

Team pages display all available data for a single team — roster, results, standings, season stats, and more. The page is built from blocks that you arrange using the Layout Builder.
All blocks automatically use the team’s current season for data. Basketball and baseball are fully supported with dedicated stats tables and aggregate data blocks.
Available Blocks
Common Blocks (all sports)
| Block | Description |
|---|---|
| Header | Logo, name, metadata, calendar, recent form |
| Info | Detailed metadata grid |
| Season Record | W-L overall + home/away splits |
| Roster | Player cards grouped by position |
| Results | Recent game results with form dots |
| Fixtures | Upcoming games as cards |
| Schedule | Month-based game navigator |
| Standings | Group standings table |
| History | Multi-season W-L records |
| Form Chart | Cumulative W-L area chart |
| Calendar | Monthly calendar with game results |
| Venue | Home stadium info |
| Staff | Coach/manager card |
| Highlights | YouTube video grid |
| Description | Custom content (post editor) |
Aggregate Stats Blocks
These blocks display league-level statistics. They support different data sources depending on the sport.
| Block | Description |
|---|---|
| Season Stats | Team’s full season statistics |
| Season Ranks | Team’s league rankings per stat |
| Season Leaders | Top performers on the team |
| Player Averages | All players’ per-game averages |
Data Sources
Each aggregate block has a Data Source setting in the Layout Builder: API (pre-computed from the API), DB (computed from per-game data), or Hybrid (tries one, falls back to the other). Baseball uses DB-only. Basketball defaults to hybrid. When data is unavailable for a league, the block hides automatically.
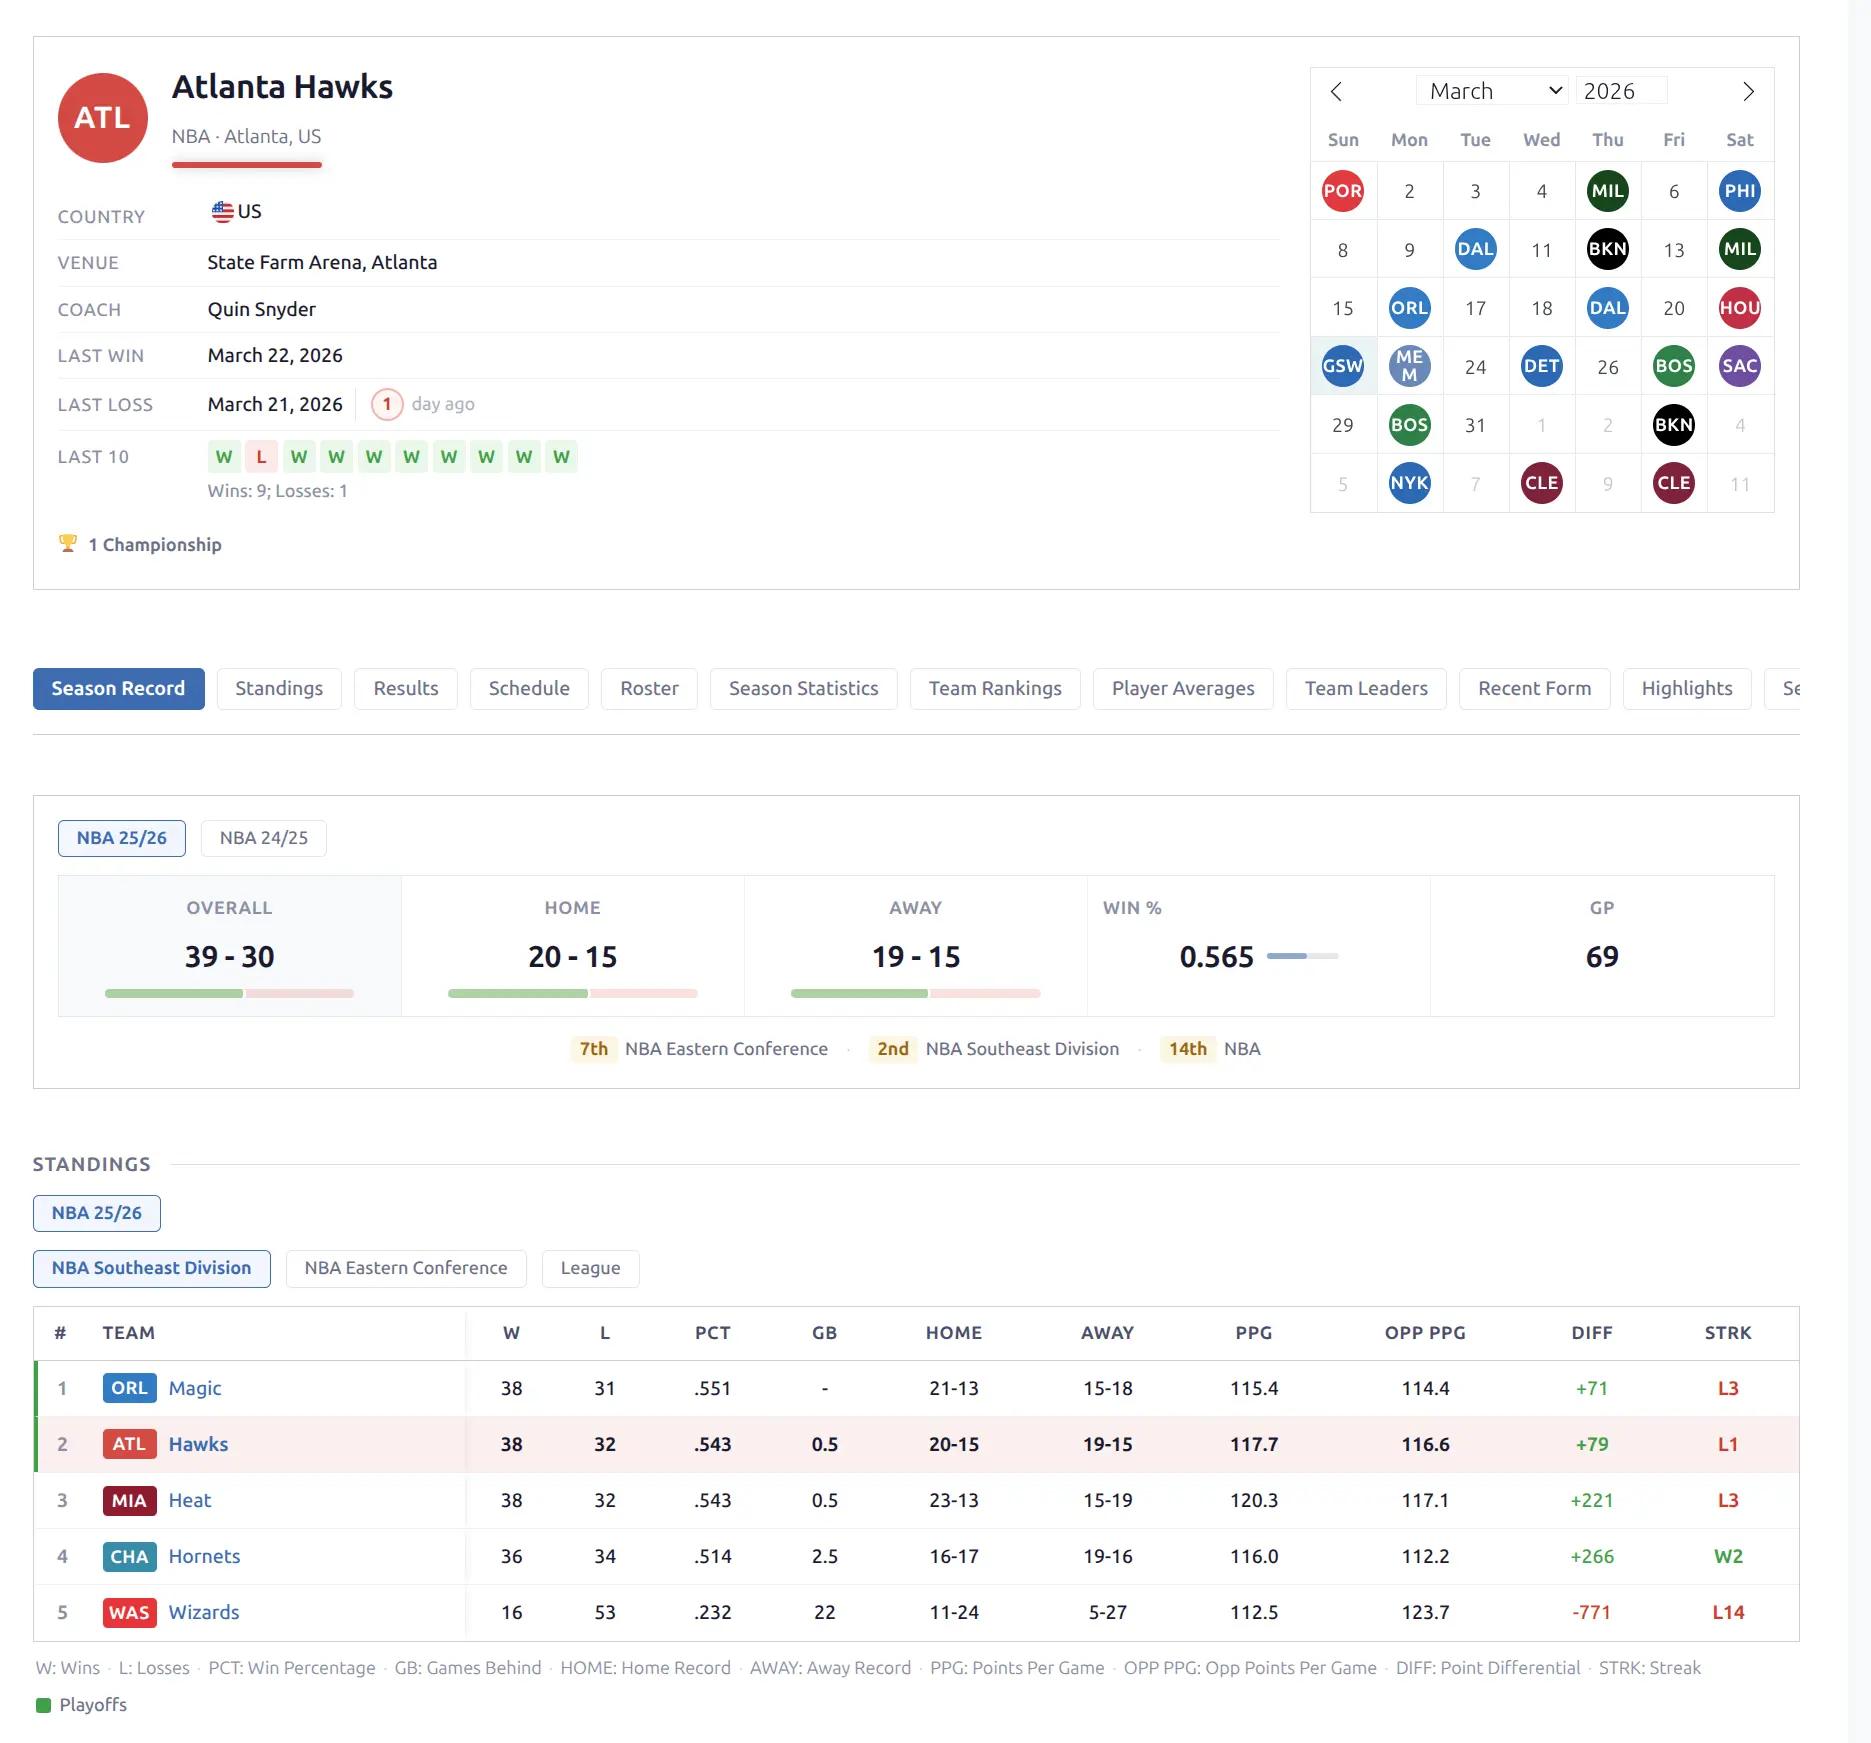
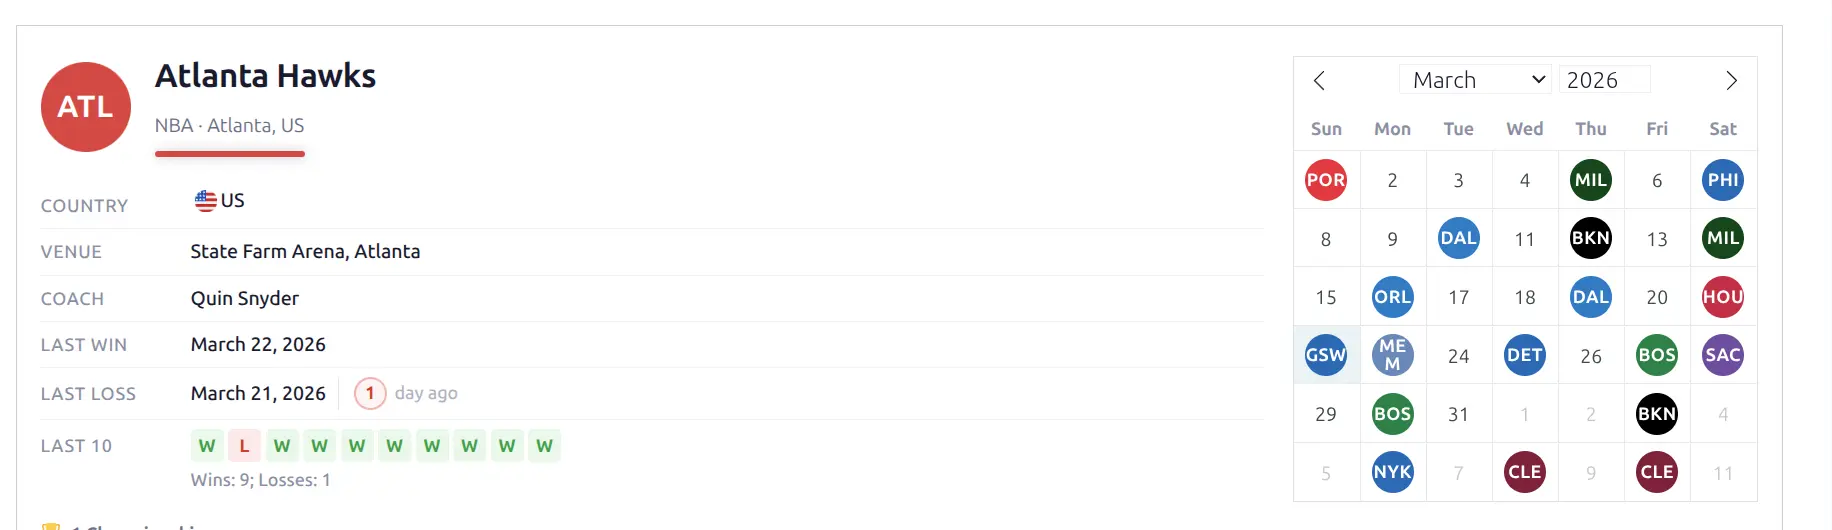
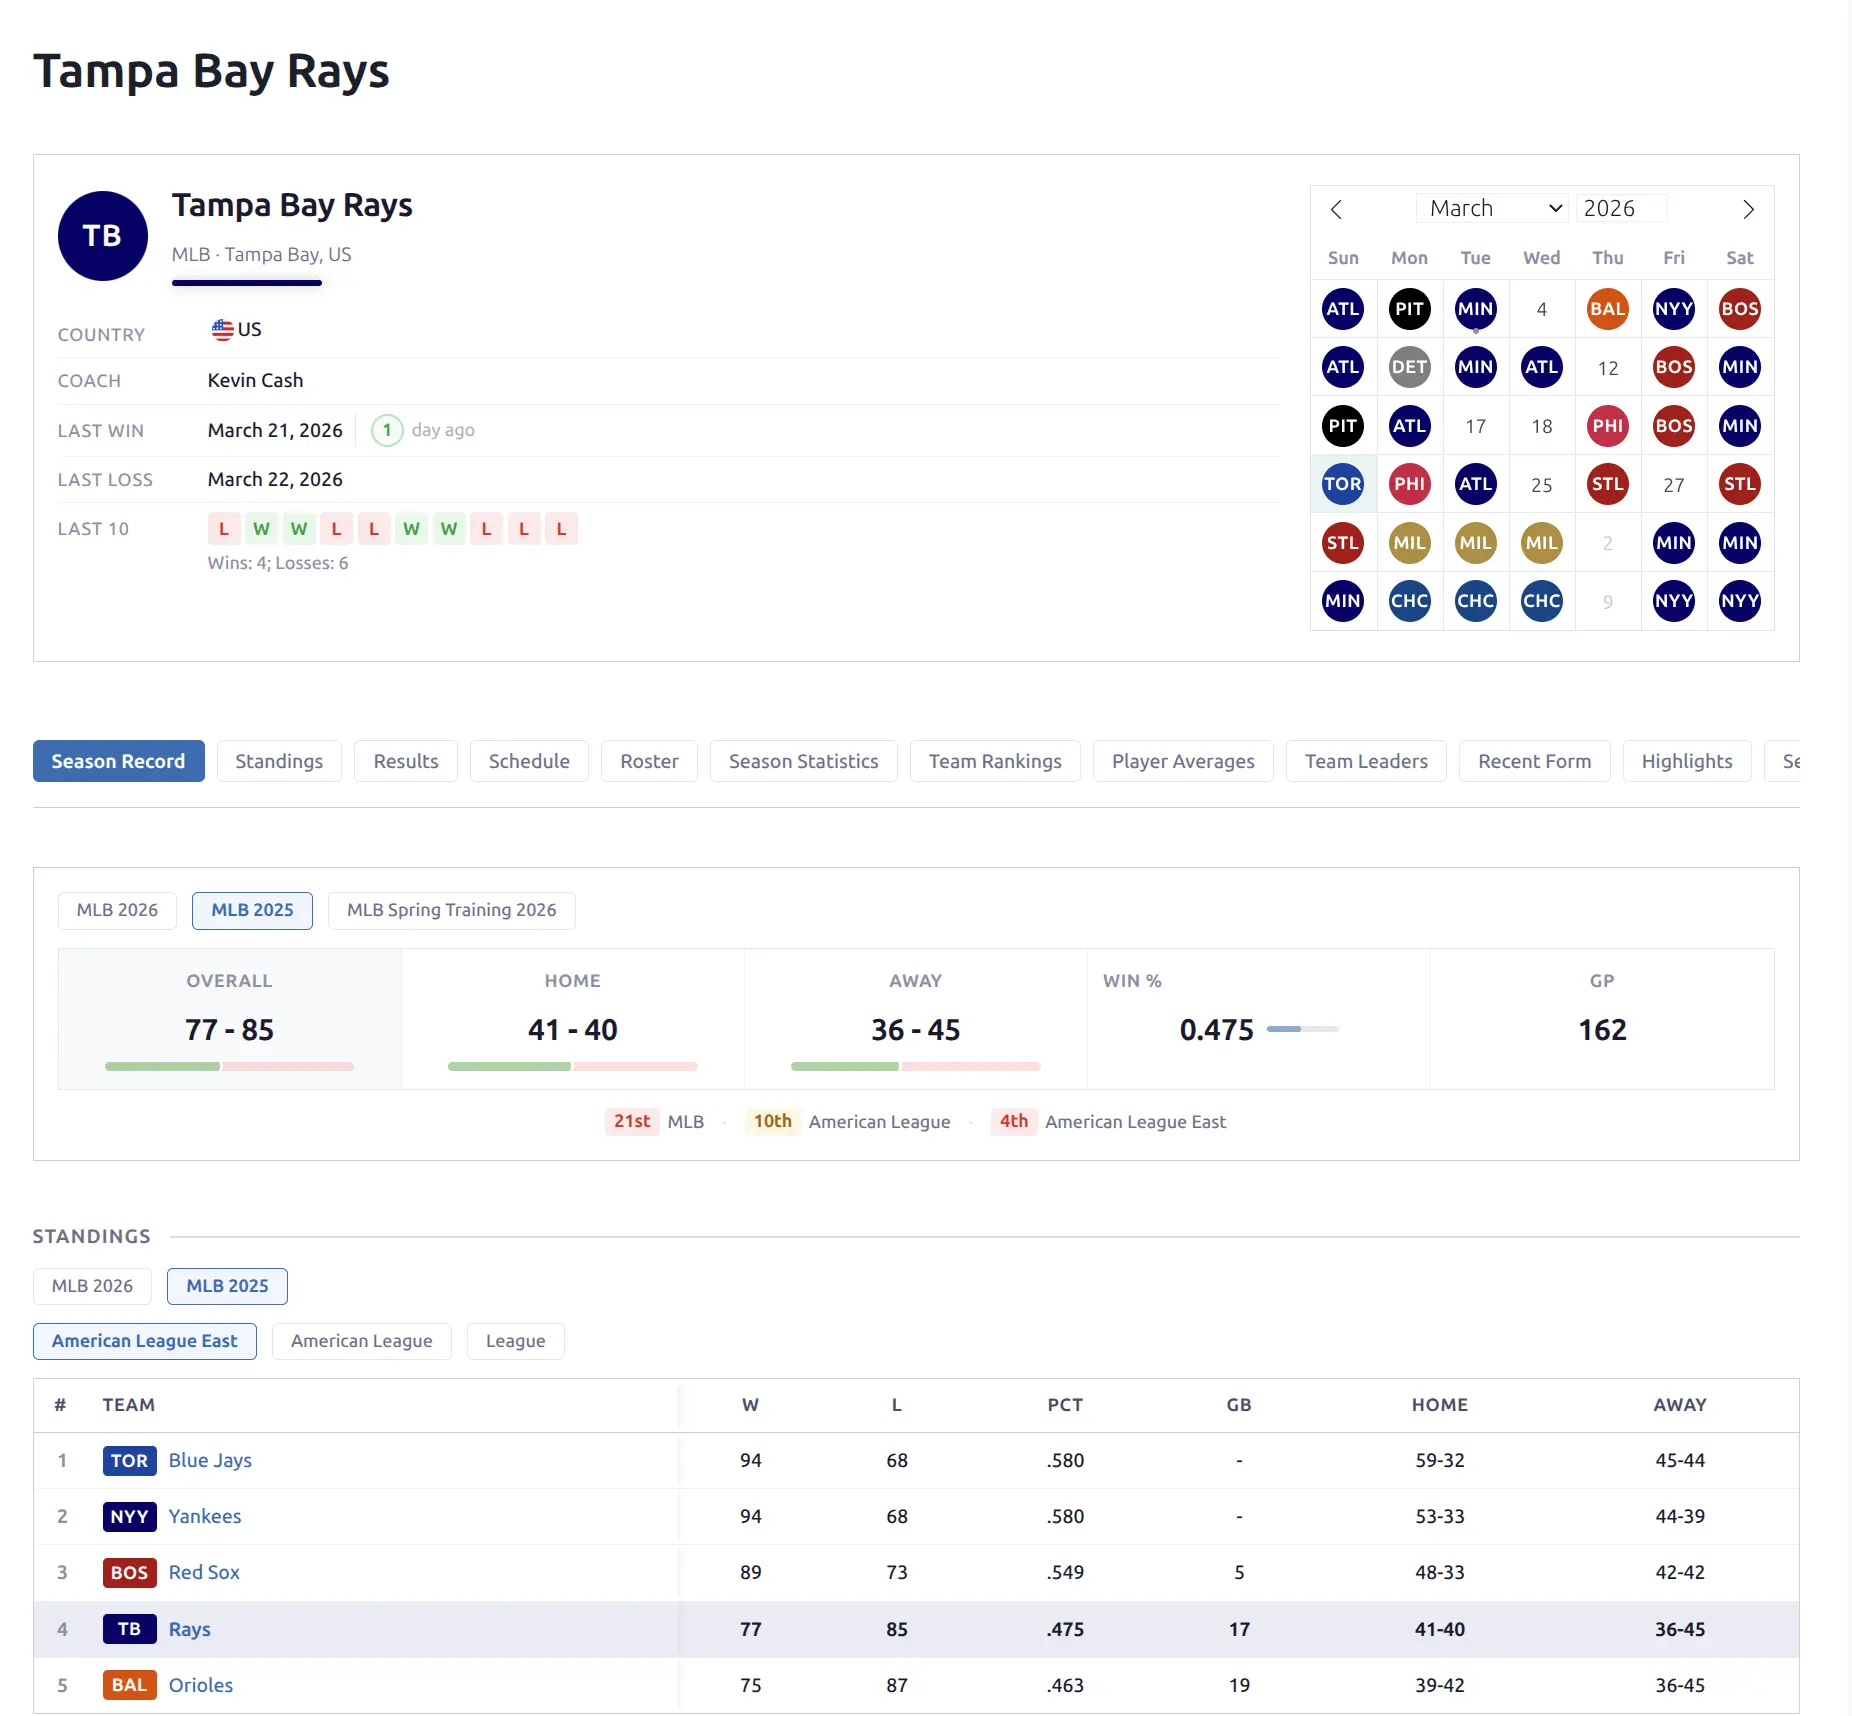
🏟️ Team Header
A two-column layout with team identity on the left and an interactive calendar on the right.
Left column:
- Team logo (large) and name
- Structured metadata: country (with flag), venue, coach, conference, division
- Last Win / Last Loss — date with colored day-count circle (green/red) and “days ago” label
- Recent form — 10 W/L squares with game peek on hover, plus win/loss count summary
Right column:
- Interactive monthly calendar showing game results
- Opponent logos on game days
- Green/red background tint for wins/losses
- Click a day to navigate to the game page
- Hover over a day to see a game peek popup
The header stacks to a single column on narrow screens.
Team Info
A standalone metadata grid showing the same data as the header info section, but as an independent block. Useful when you want metadata in a different position or without the full header.
Fields: country, venue, coach, conference, division, founded year.
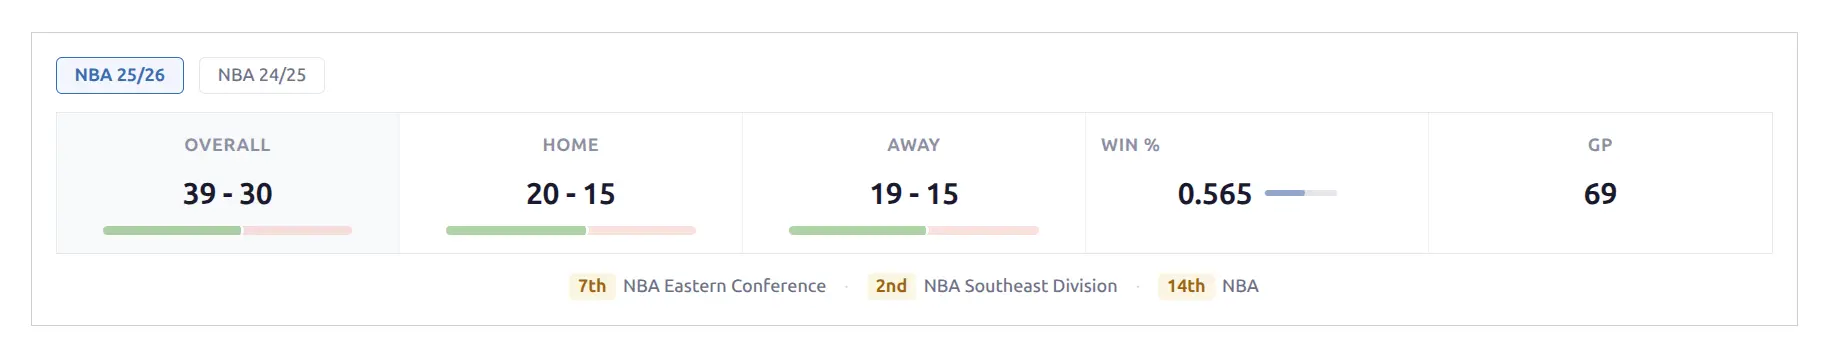
Season Record
Compact W-L display with colored ratio bars showing wins (green) and losses (red) proportionally.
- Overall — Total W-L
- Home — Home record
- Away — Away record
- PCT — Win percentage
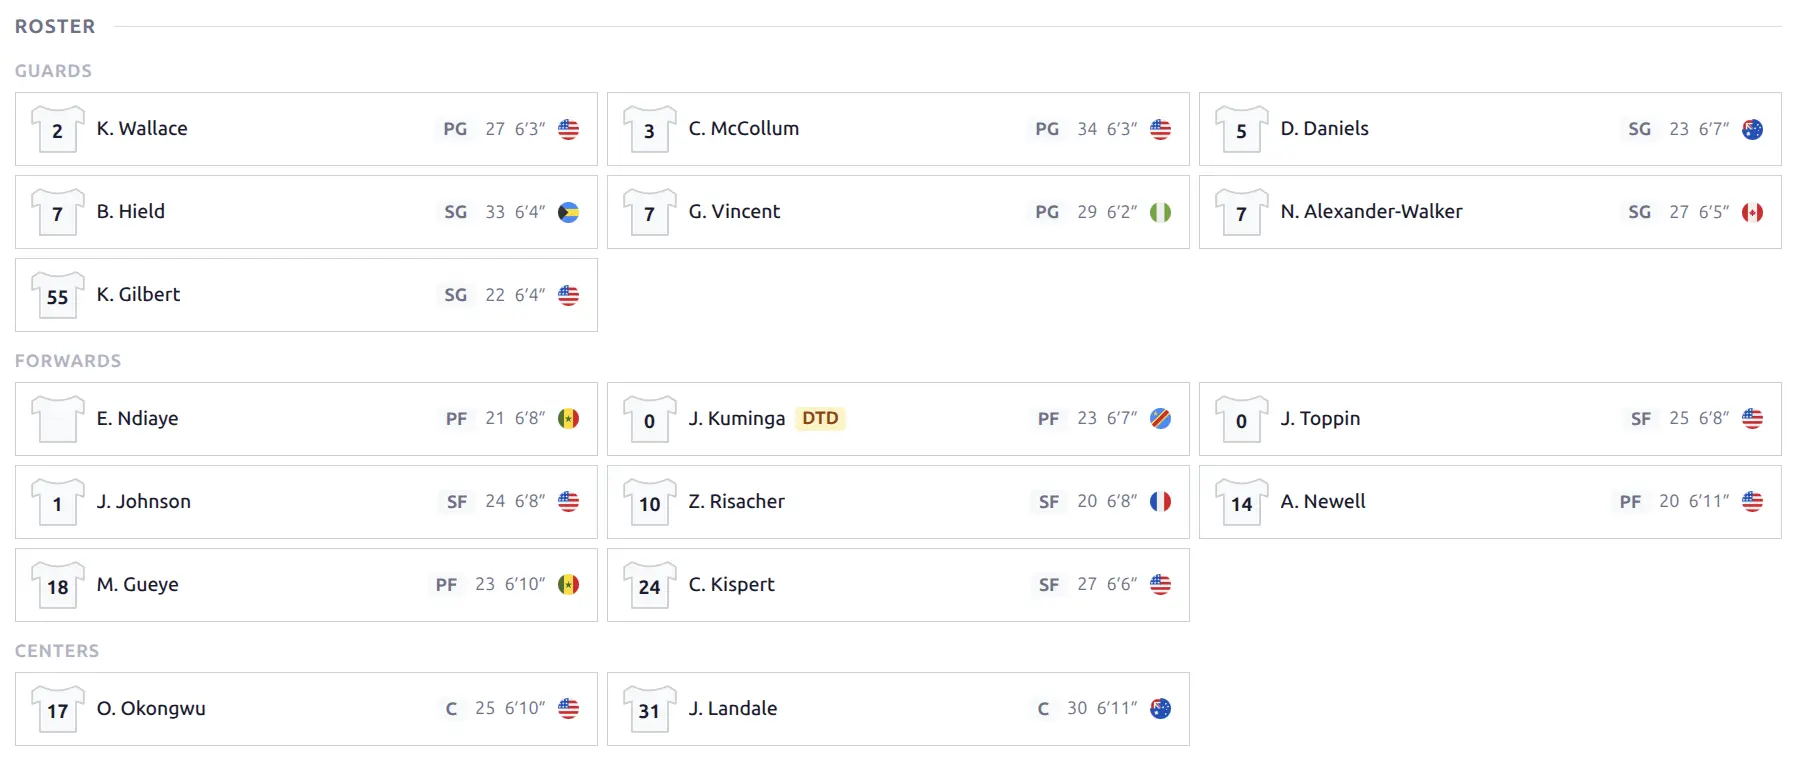
Roster
Player cards in a responsive grid layout, grouped by position.
Each card shows jersey number with shirt icon, player photo, name (linked to player page), position, key stats, and injury indicator when applicable.
Position groups:
- Basketball: Guards, Forwards, Centers
- Baseball: Pitchers, Infield, Outfield
- Other sports: Grouped alphabetically by position
Players are sorted by jersey number within each group.
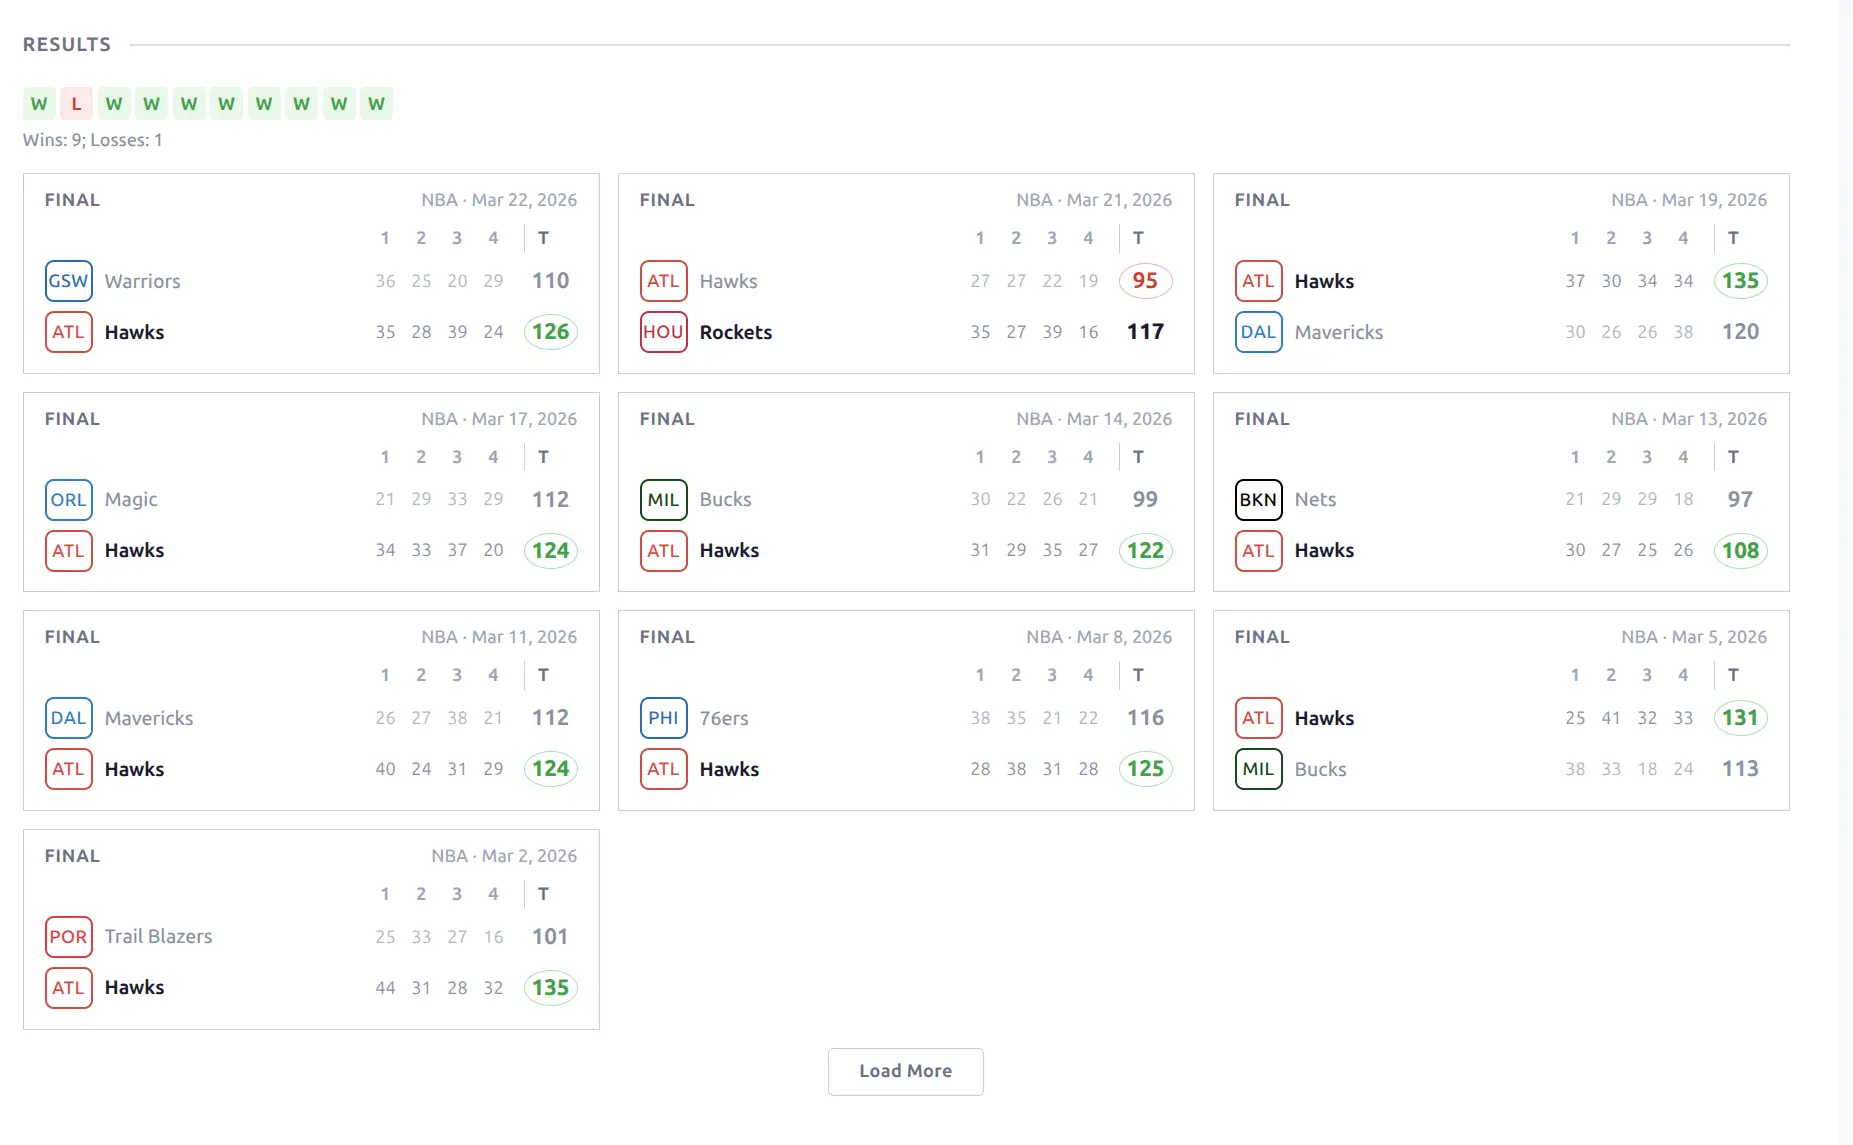
Results
Recent completed games with form indicators and game cards.
- Form dots — W/L labeled squares (last 10 games) with game peek on hover
- Win/loss summary — e.g., “Wins: 7; Losses: 3”
- Game cards — full game cards in a grid below
Tip
Enable the Show Leaders toggle in the Layout Builder to add a top performer stat line to each game card — showing the player with the most points (basketball) or hits (baseball).
A Load More button appends additional results.
Fixtures
Upcoming scheduled games displayed as game cards in a grid. Shows opponent, date/time (auto-converted to visitor timezone), and venue. Includes a Load More button for additional fixtures.
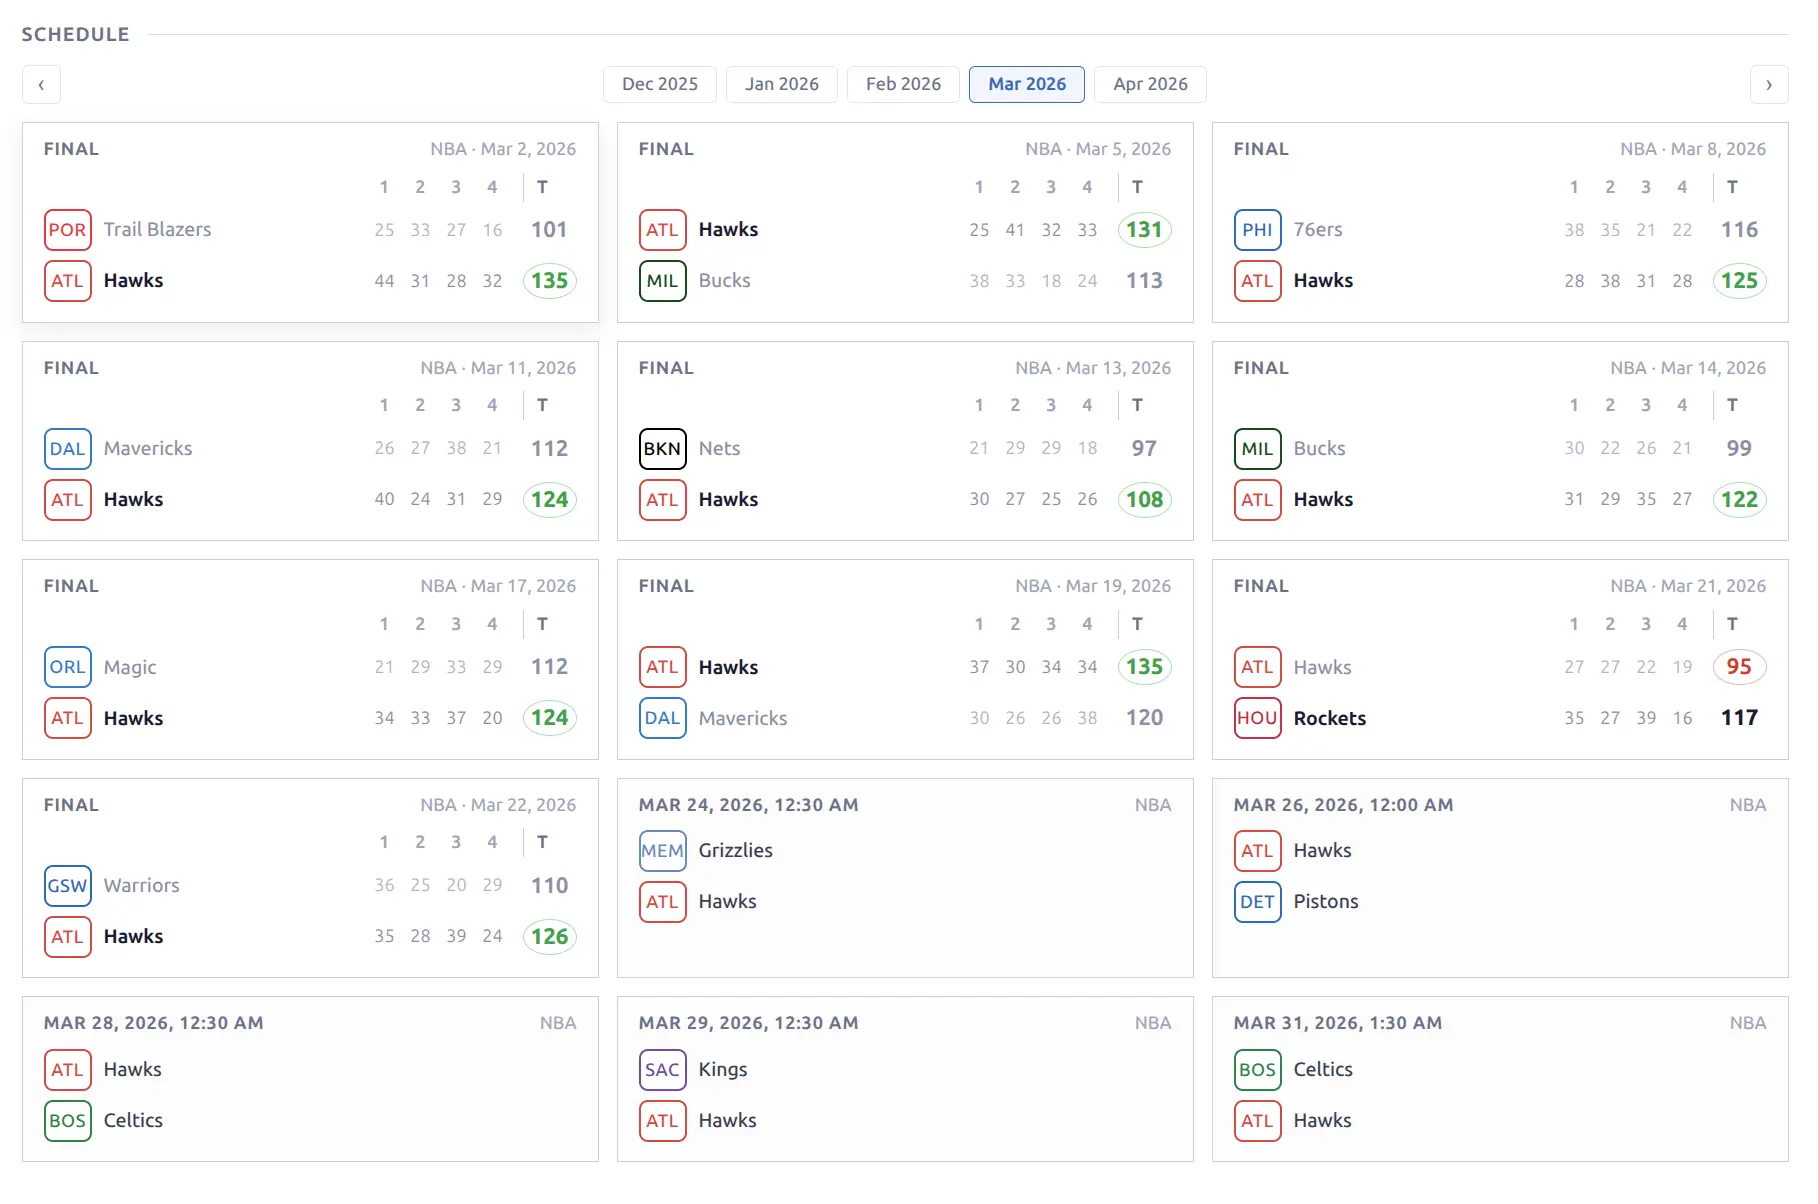
📅 Schedule
A month-based game navigator with a windowed pill bar showing month names.
- Month pills (5 visible on desktop, 3 on mobile) with arrow navigation
- Game cards loaded dynamically for each month
- In-memory cache — revisiting a month is instant
- Responsive layout with game cards in a fluid grid
The schedule shows all games for the team in the selected month, regardless of season.
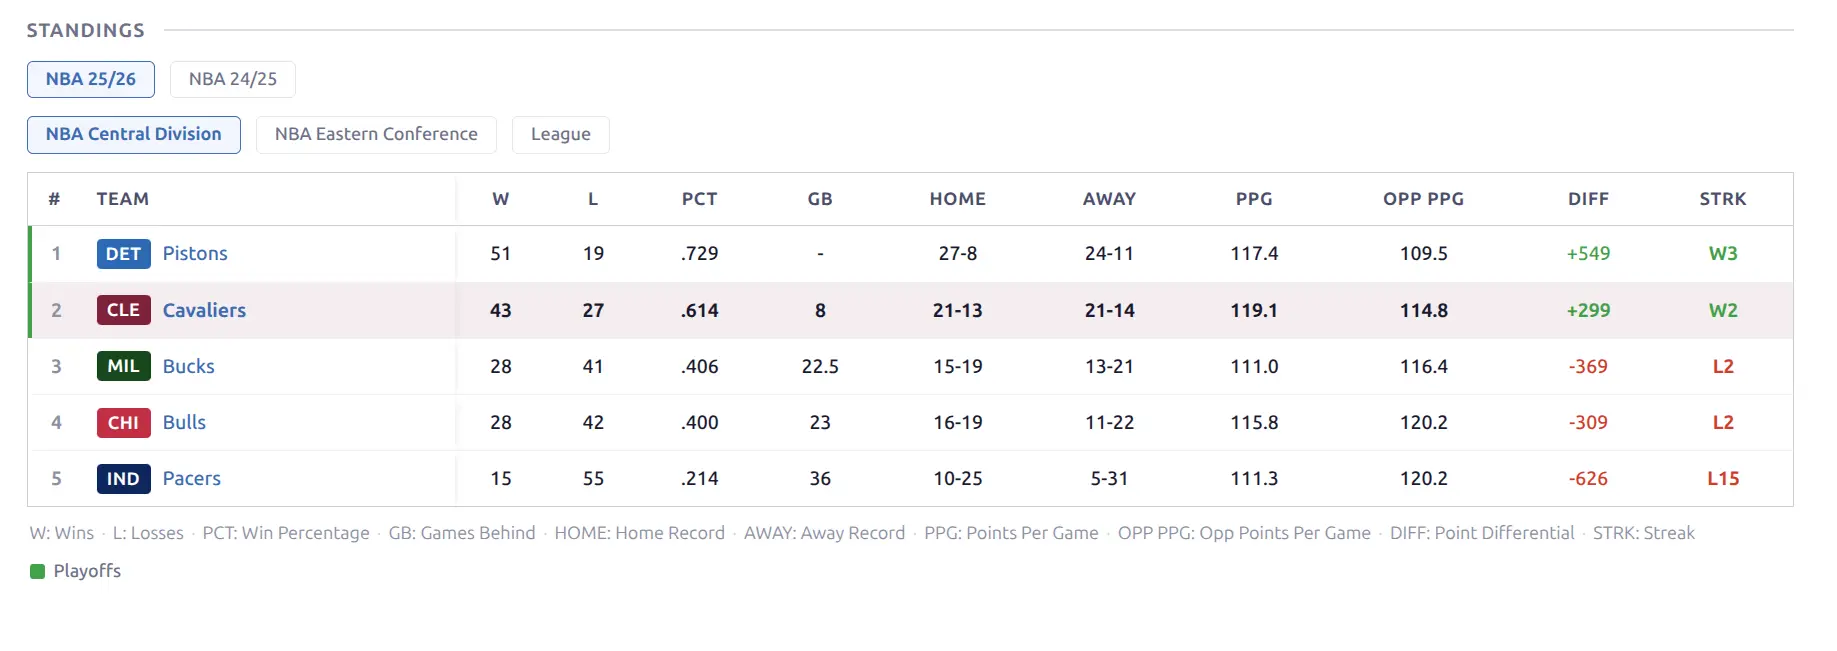
Standings
The current season’s group standings table. The focus team’s row is highlighted with a colored left border using the team’s primary color.
- Home / Away pills — switch between overall, home-only, and away-only records
- Sport-specific columns (wins, losses, percentage, games behind, streak, etc.)
- Frozen rank and team columns for horizontal scrolling
Data comes from the API’s standings endpoint.
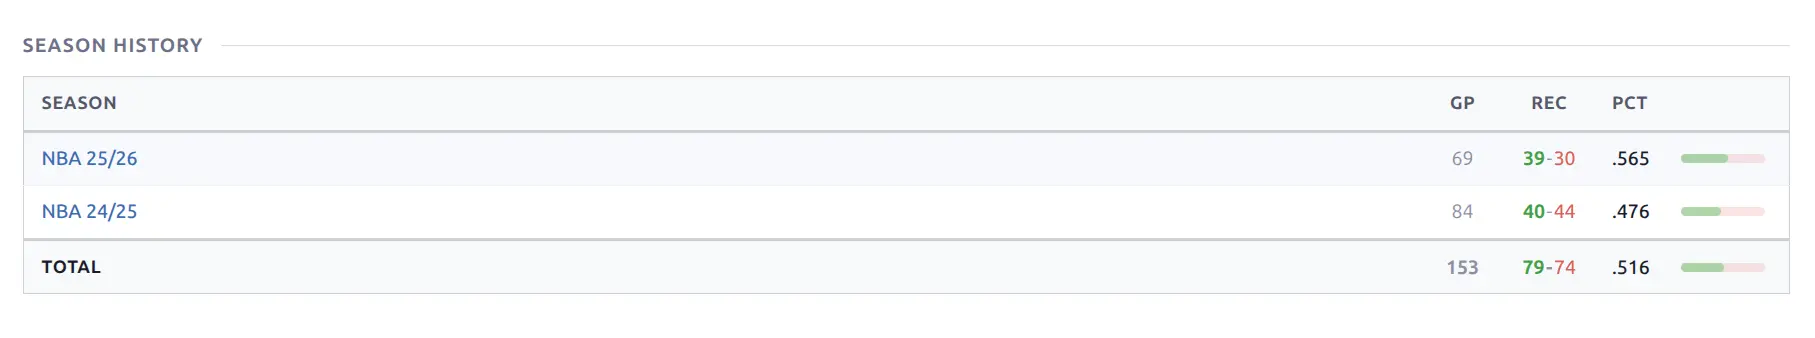
History
Multi-season W-L records showing the team’s performance across past seasons.
- Combined record format — green wins / red losses per season
- Games Played column
- Ratio bars showing W-L proportion
- League grouping — seasons grouped by league with background band headers and subtotals
- Career totals footer row
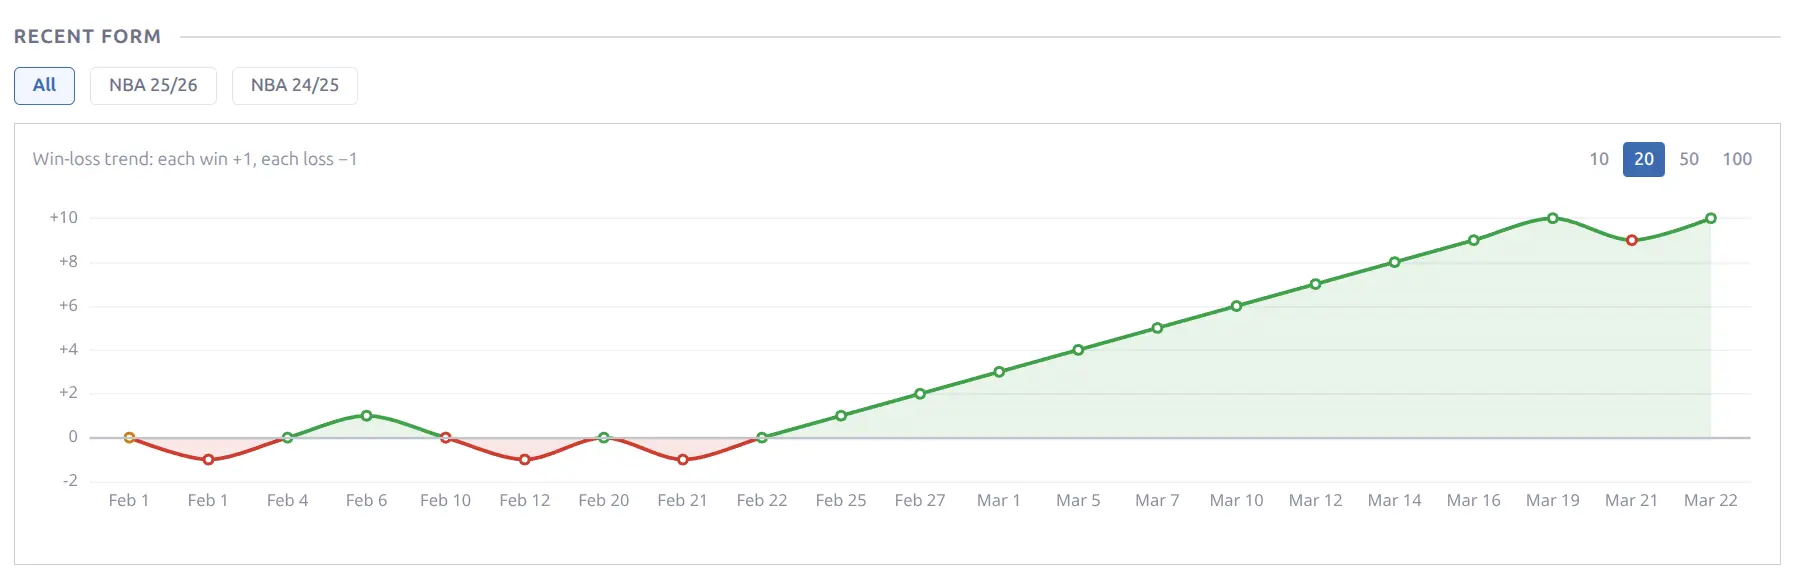
Form Chart
An area chart showing cumulative wins and losses over the season. The chart fills with the team’s primary color, providing a visual trend of the season’s progression.
Calendar
An interactive monthly calendar showing game results with opponent team logos on game days. Green background tint for wins, red for losses. Click to navigate to the game page, hover for a game peek popup.
Available as a standalone block or integrated into the Team Header.
📊 Aggregate Stats
Four blocks that display league-level team and player statistics. All feature season pills for switching between seasons without page reload.
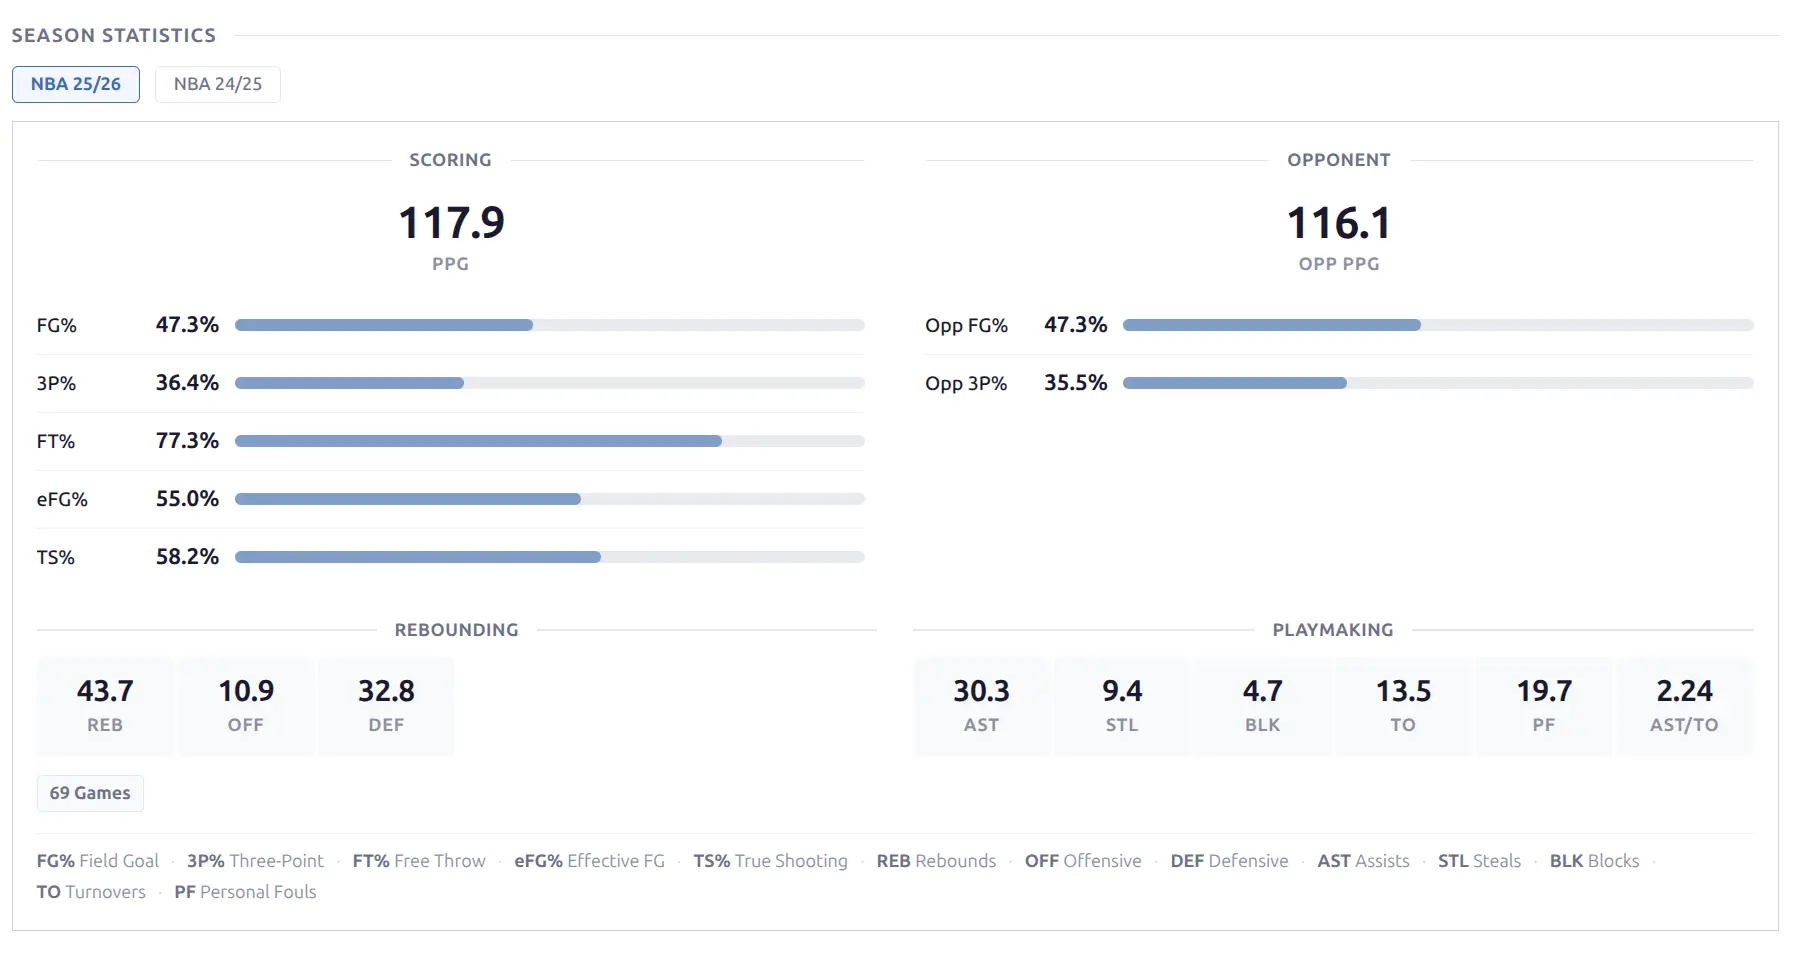
Season Stats
The team’s full season statistics displayed as a compact bordered card with stat labels and values.
Basketball: Points per game, rebounds, assists, field goal percentage, 3-point percentage, free throw percentage, turnovers, steals, blocks, fouls.
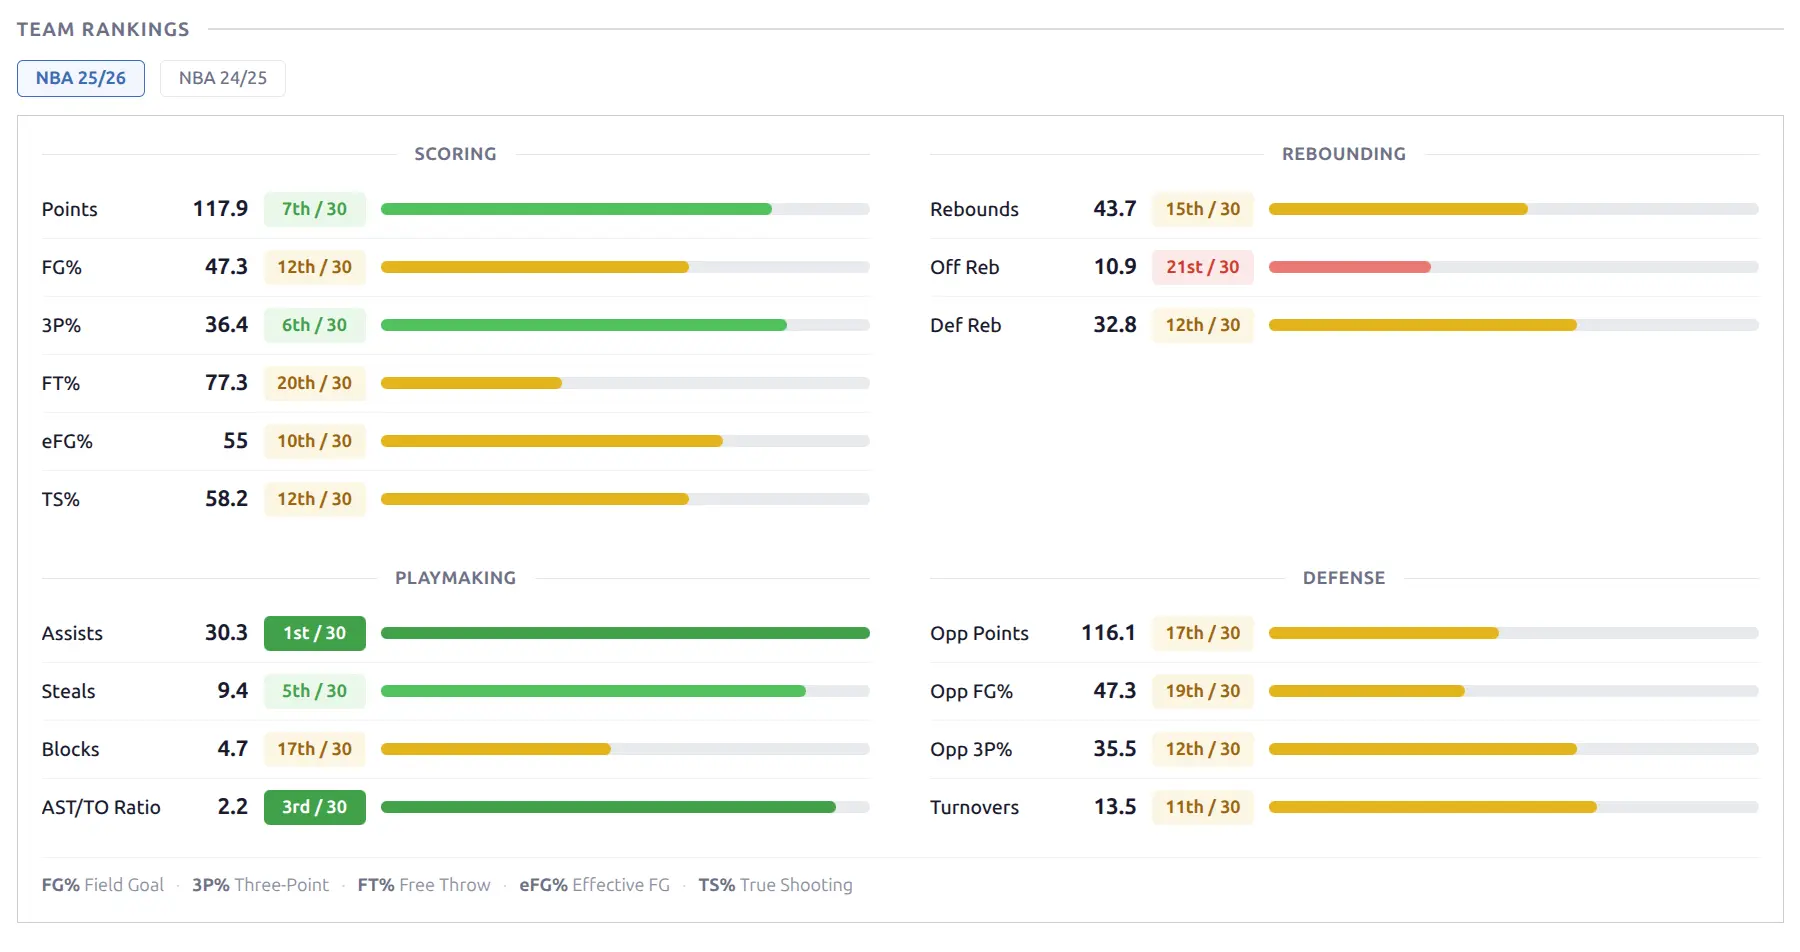
Season Ranks
The team’s league-wide ranking for each statistical category. Each stat shows the rank number with a tier-colored badge — elite (top ranks), good, average, below average, or poor.
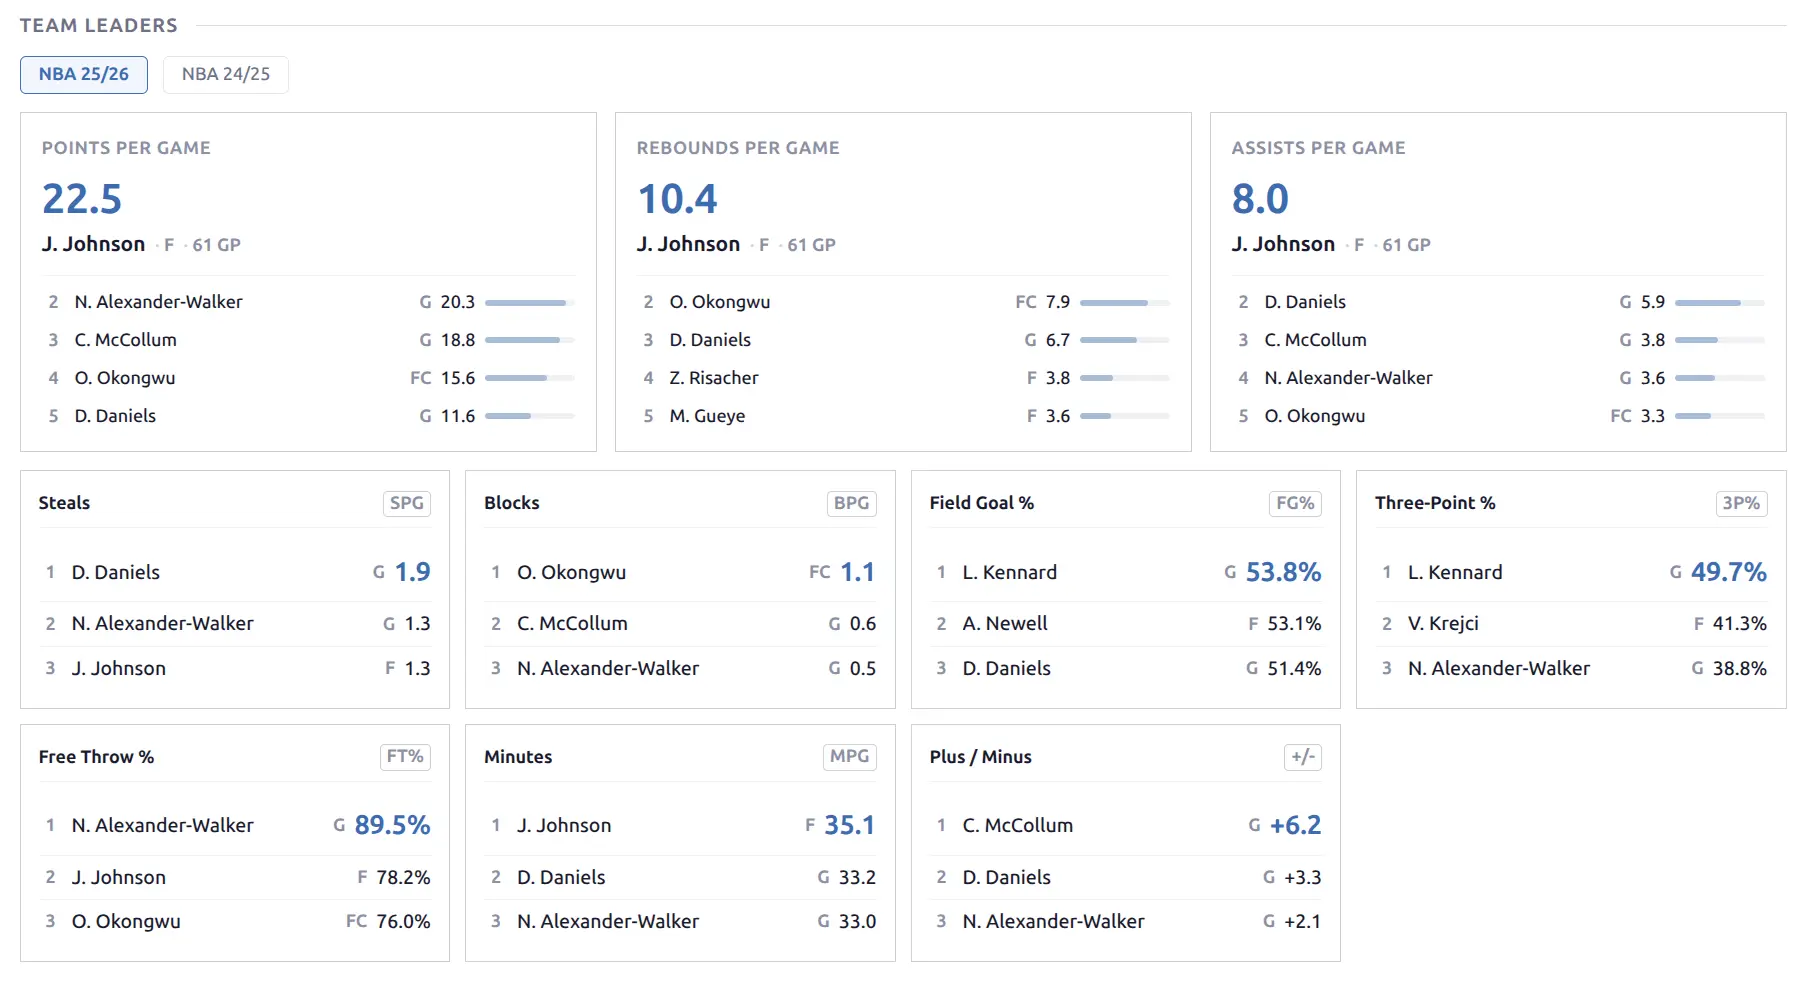
Season Leaders
Top performers on the team for key statistical categories.
Basketball: Hero cards for the top 3 categories (PPG, RPG, APG) — each showing the leader’s photo, name, and per-game average. Additional categories shown in a compact format below.
Baseball: Separate batting and pitching leader sections.
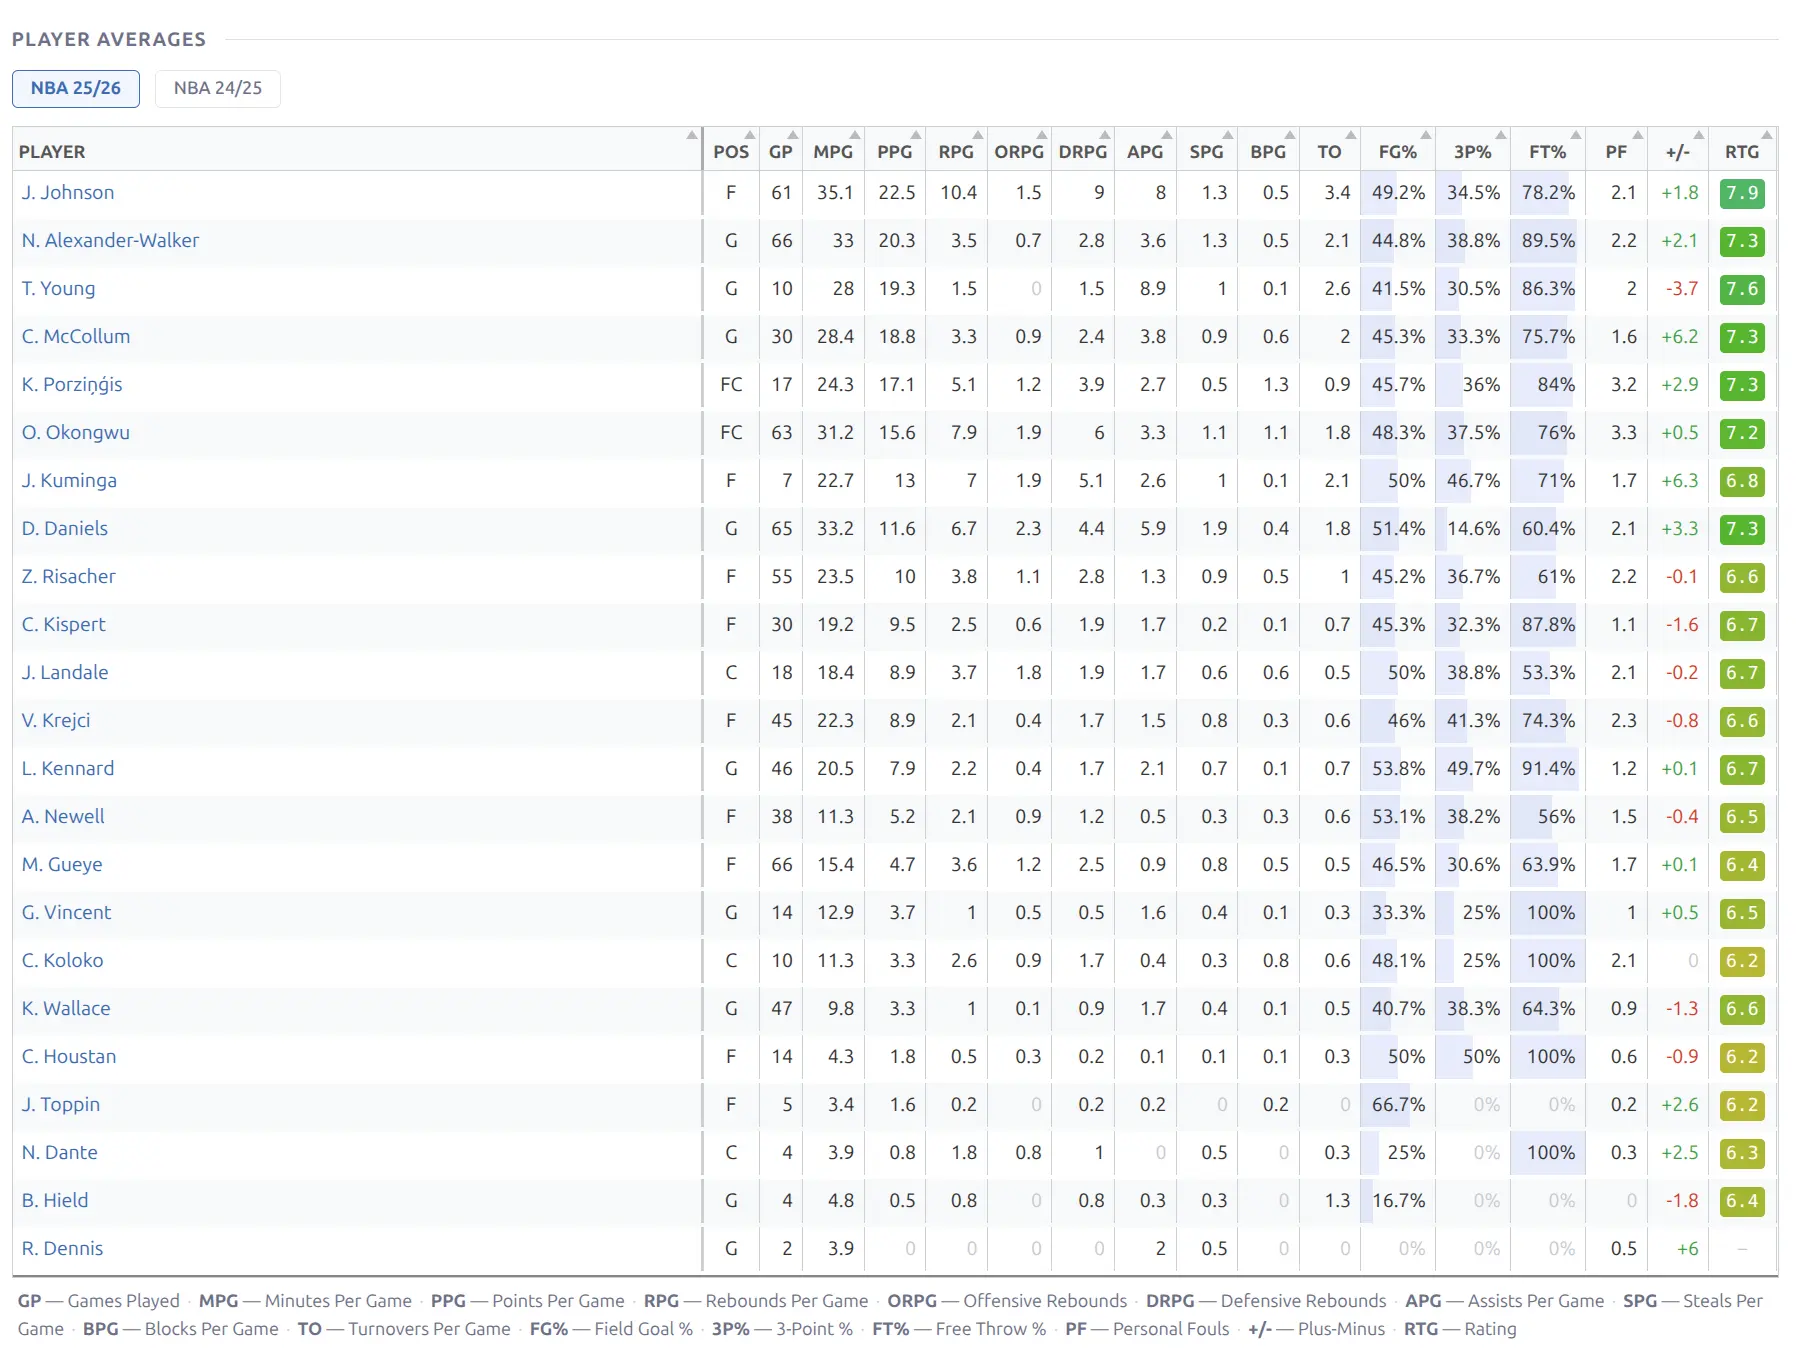
Player Averages
A full-width sortable table showing per-game averages for all players on the team’s roster. Click any column header to sort.
Basketball columns: G, MPG, PPG, RPG, APG, SPG, BPG, TO, FG%, 3P%, FT%, +/-
Baseball: Separate batting and pitching sections.
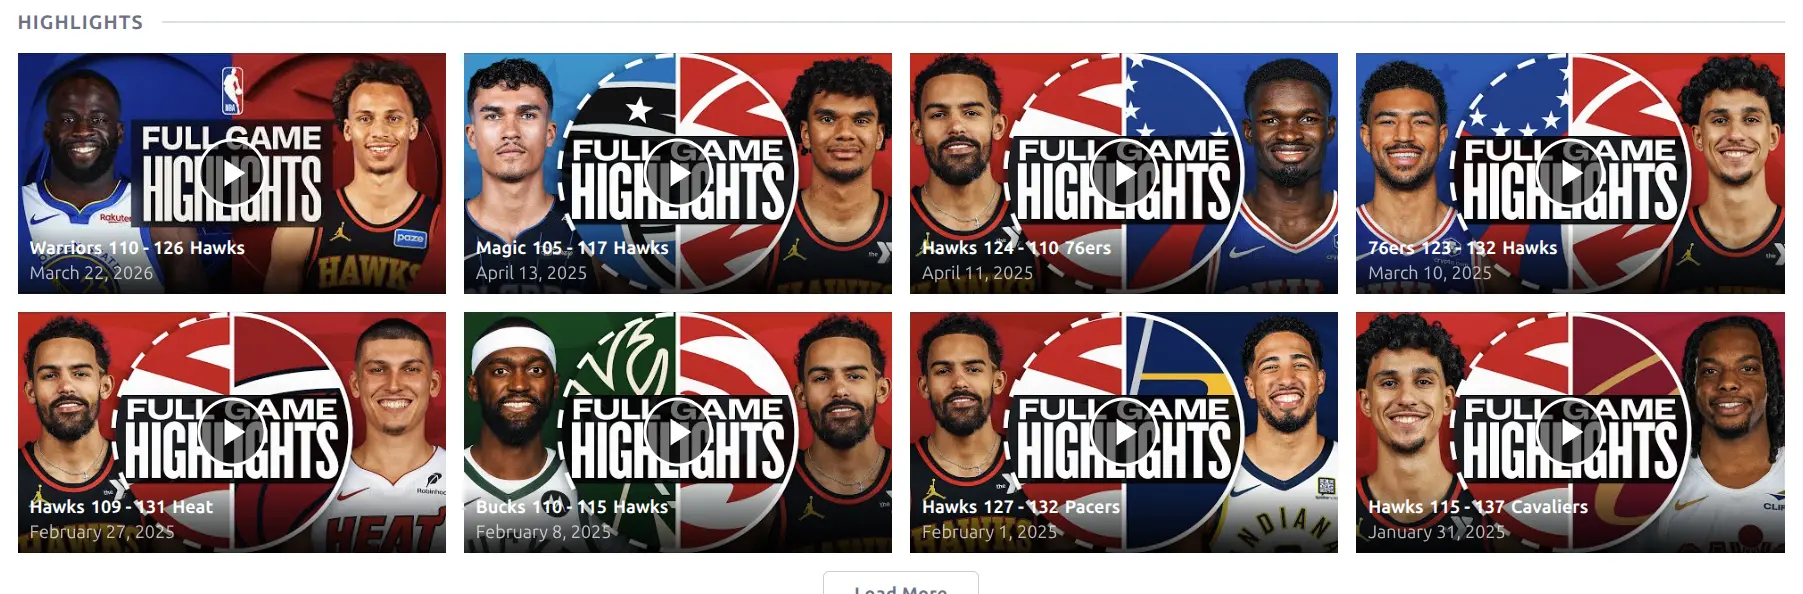
Highlights
YouTube video highlights for the team’s games. Displayed as a responsive card grid — each card shows the video thumbnail with a play button overlay, team logos, score, and date. Click a card to play the video.
Venue, Staff & Description
Venue — Home stadium/arena info card showing name, city, country, and capacity.
Staff — Coach/manager card showing role and name.
Description — Custom content from the WordPress post editor. Edit from the team’s post in Hub Data > Teams. Useful for adding editorial content or notes not available from the API.
🏀 Baseball Team Page
Baseball team pages use the same block set but with sport-specific stat columns and additional batting/pitching sections in the aggregate blocks.
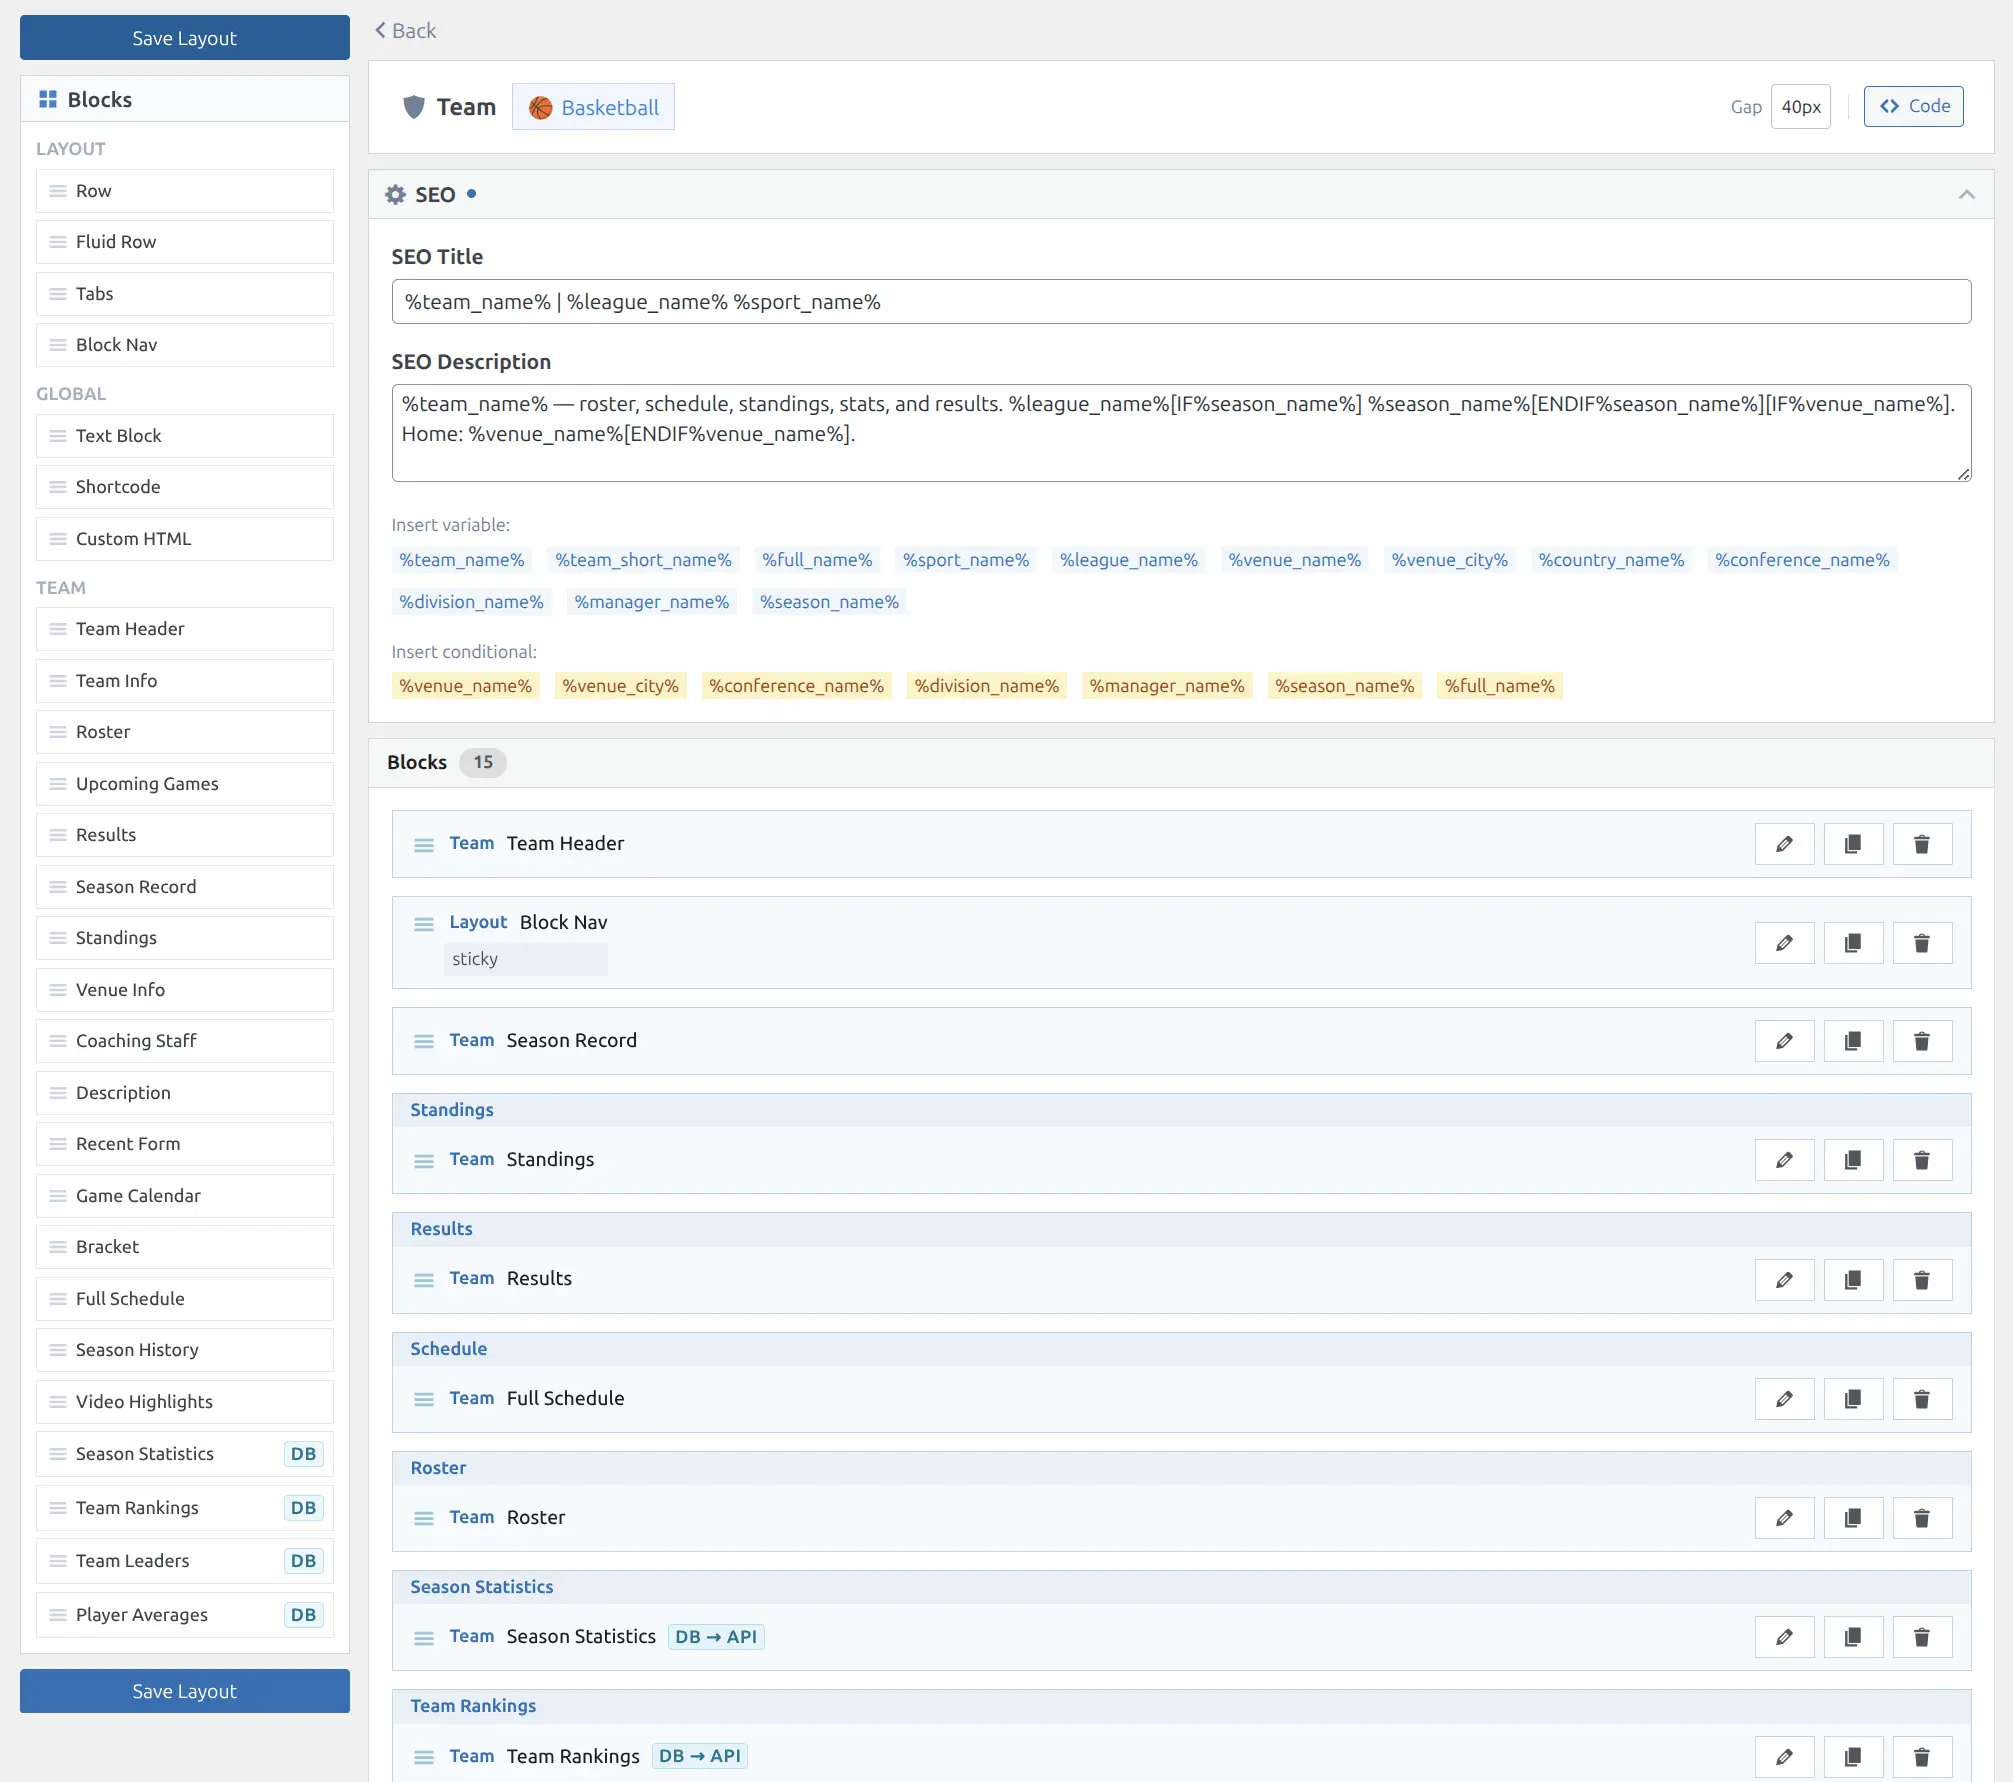
🔧 Customizing the Layout
Use the Layout Builder to rearrange, add, or remove blocks on the team page. Each sport has its own team layout.
📚 Related
- Layout Builder — Arrange and customize blocks on team pages
- Player Pages — Player profiles linked from roster
- Shortcodes — Embed team-related content (roster, team-stats, standings)
- Caching — Aggregate stats caching settings