

Season pages display league-specific data for a particular season — standings, playoff bracket, game results, team and player statistics, and more. The page is built from blocks that you arrange using the Layout Builder. Use the header dropdown to switch between seasons within the same league.
Available Blocks
Core Blocks
| Block | Description |
|---|---|
| Header | League logo, season year, dropdown to switch seasons |
| Standings | League standings with Home/Away and Division/Conference/League pills |
| Cup Tree / Bracket | Playoff bracket visualization (mirror + linear layouts) |
| Upcoming Games | Scheduled games in a card grid with odds |
| Results | Completed games in a card grid |
| Teams | Team card grid grouped by conference/division |
| Scoreboard | Date-navigated game grid with status filters |
| Highlights | YouTube video grid with team filter pills |
| Description | Custom content from the post editor |
Aggregate Stats Blocks
| Block | Description |
|---|---|
| Stat Leaders | Top performers across the league (hero cards + compact grid) |
| Team Rankings | Rank badges per stat, grouped by category |
| Player Averages | Full player comparison table (sortable) |
| Team Statistics | All teams × all stats comparison table |
All aggregate stats blocks compute from per-game data stored in the database. No season pills — use the header dropdown to switch between seasons. When data is unavailable for a league, the block hides automatically.
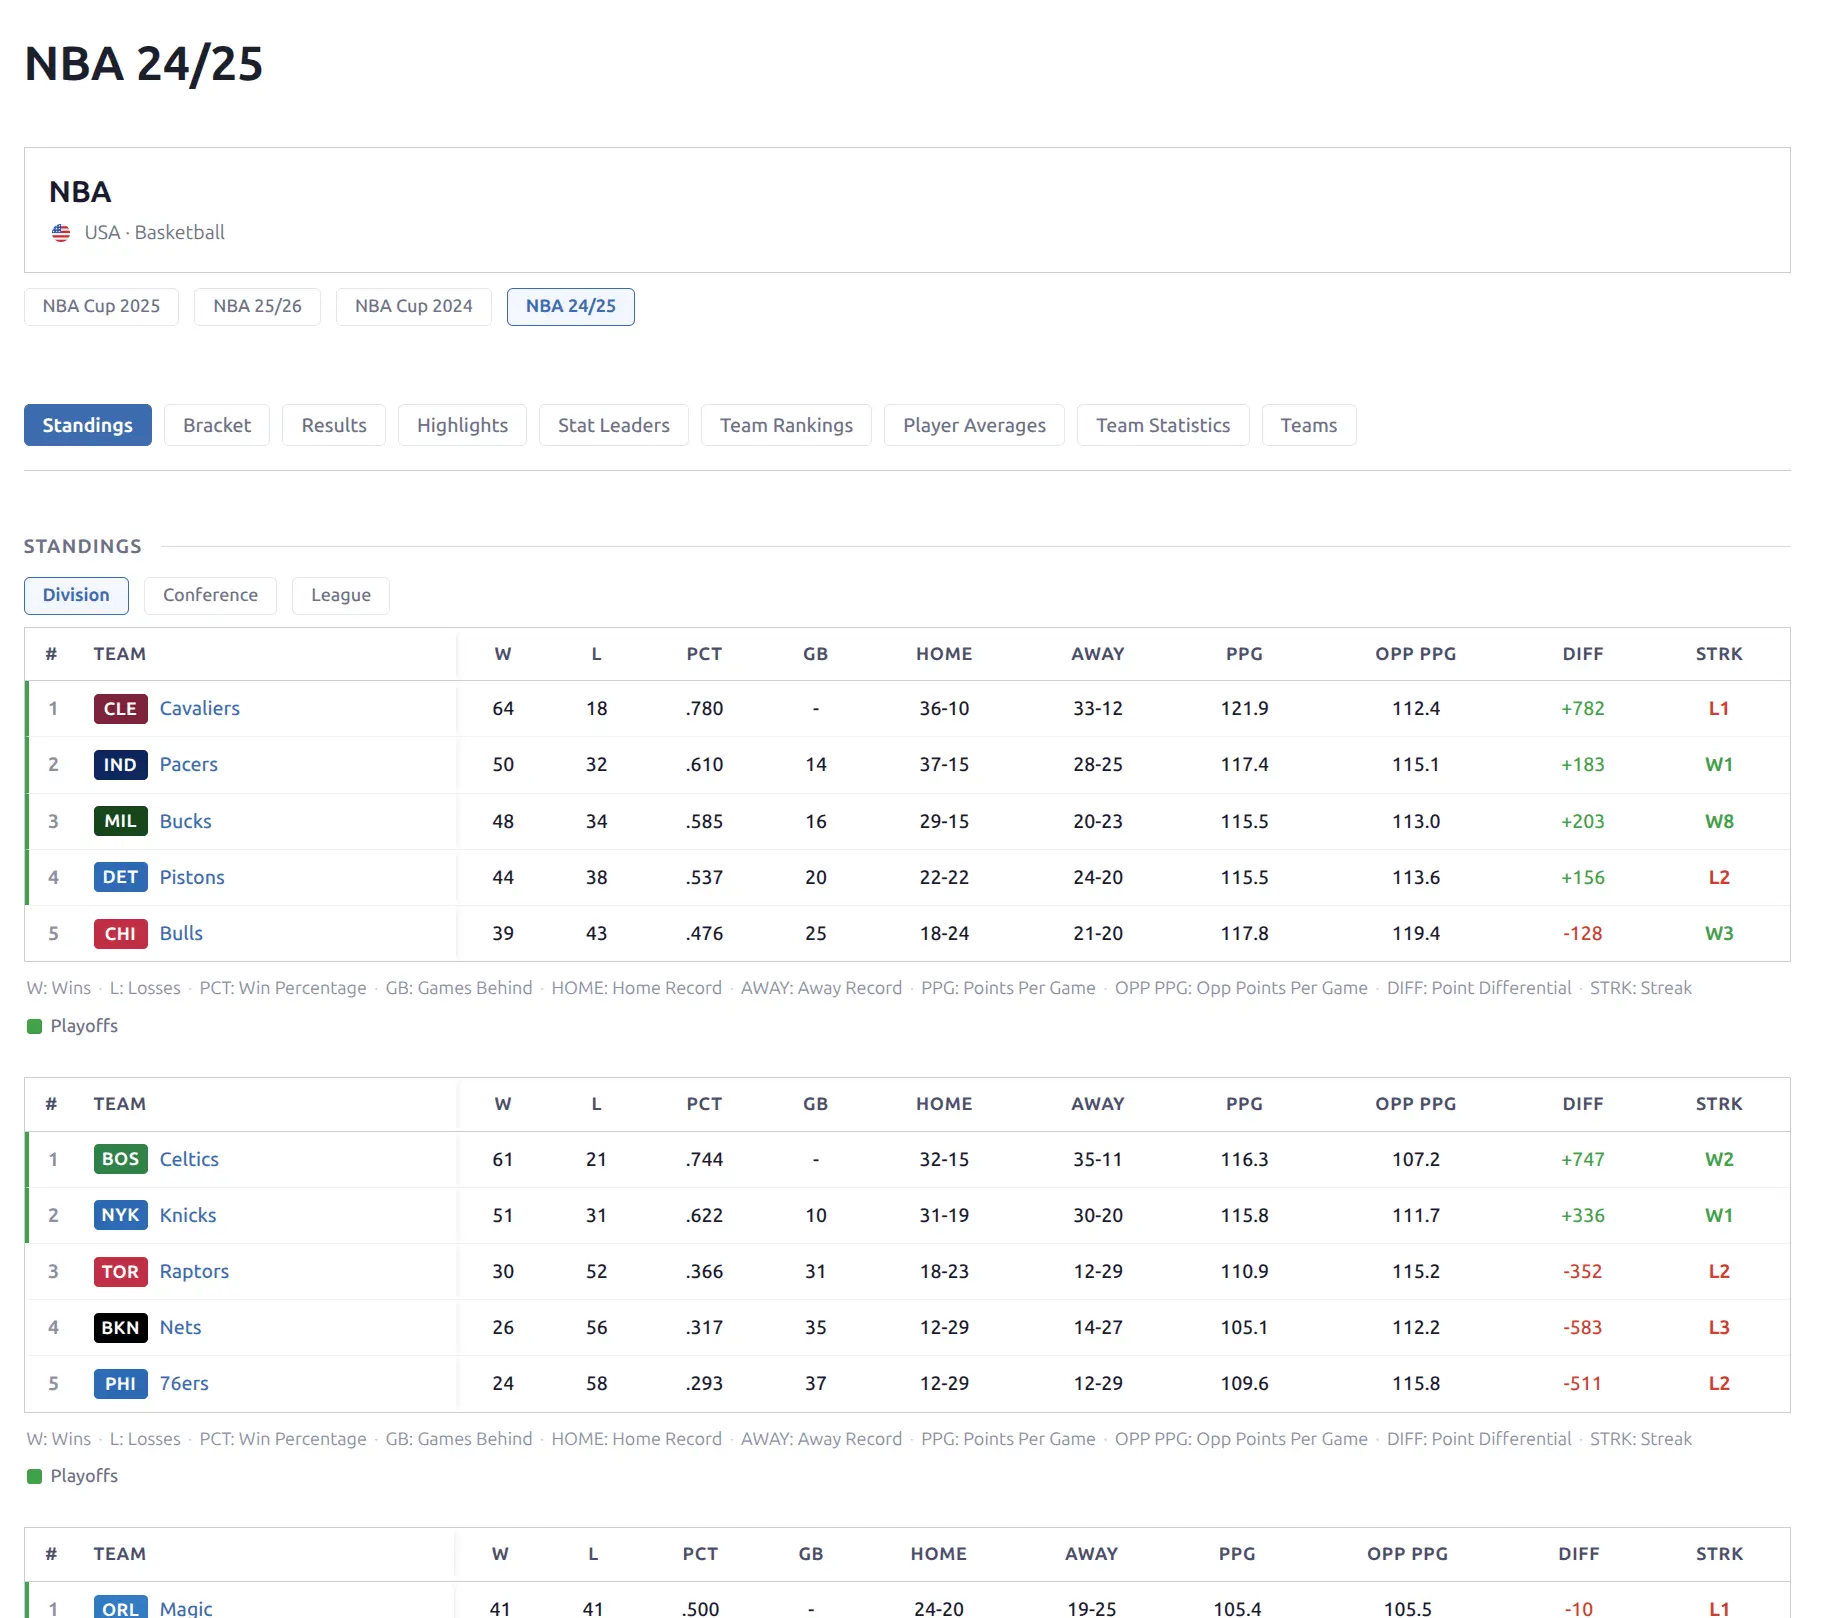
Season Header
The header block shows the league logo (or country flag depending on your Display settings), season year, and a dropdown to navigate between seasons within the same league. When multiple seasons share the same year, the dropdown shows the API season name to distinguish them.
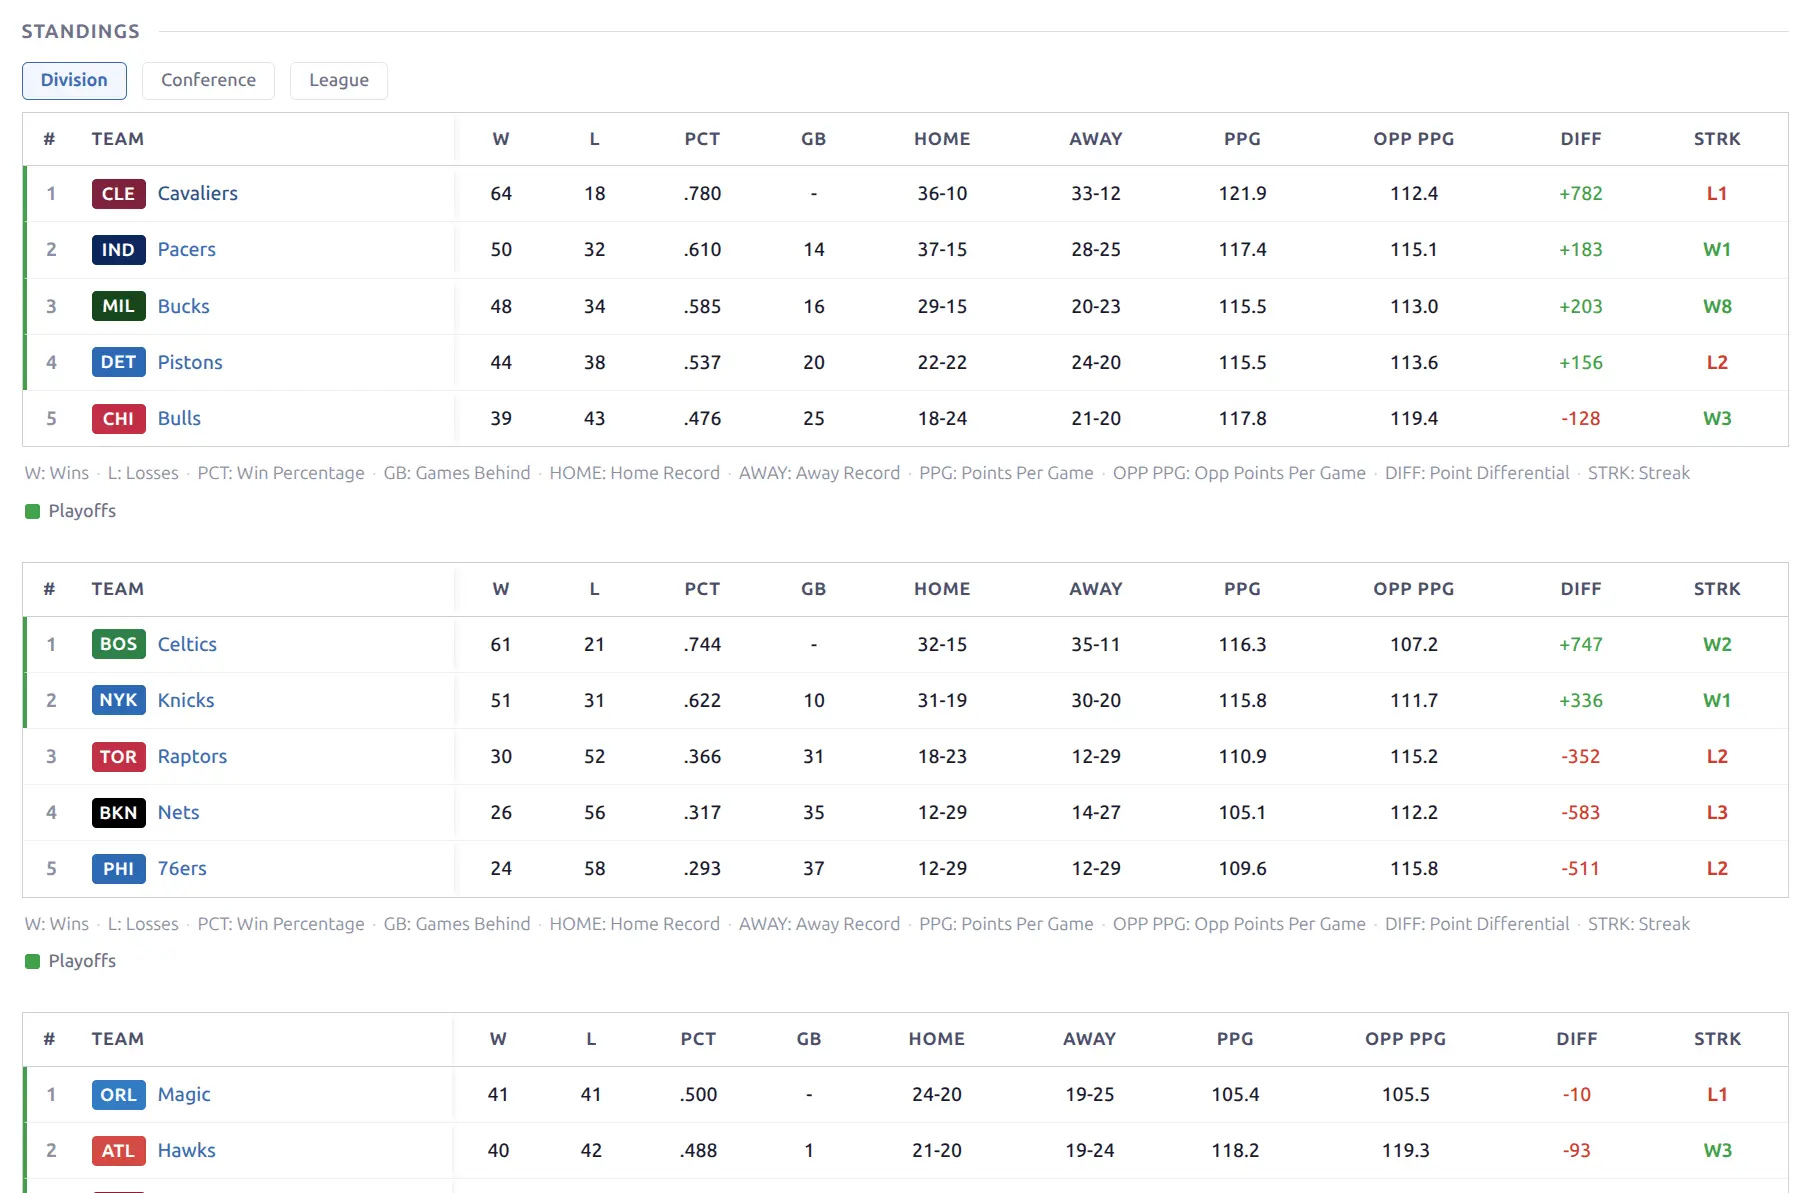
🏀 Standings
The standings block displays league standings as a sortable table with multiple view modes.
- Level pills — Division, Conference, League (above the card)
- Home / Away pills — filter to home or away records only (outside the bordered card)
- Sport-specific columns: W, L, PCT, GB, Home, Away, PPG, OPP PPG, DIFF, Streak
- Each group (division/conference) shows as a separate table section
- Column abbreviation legend below each table
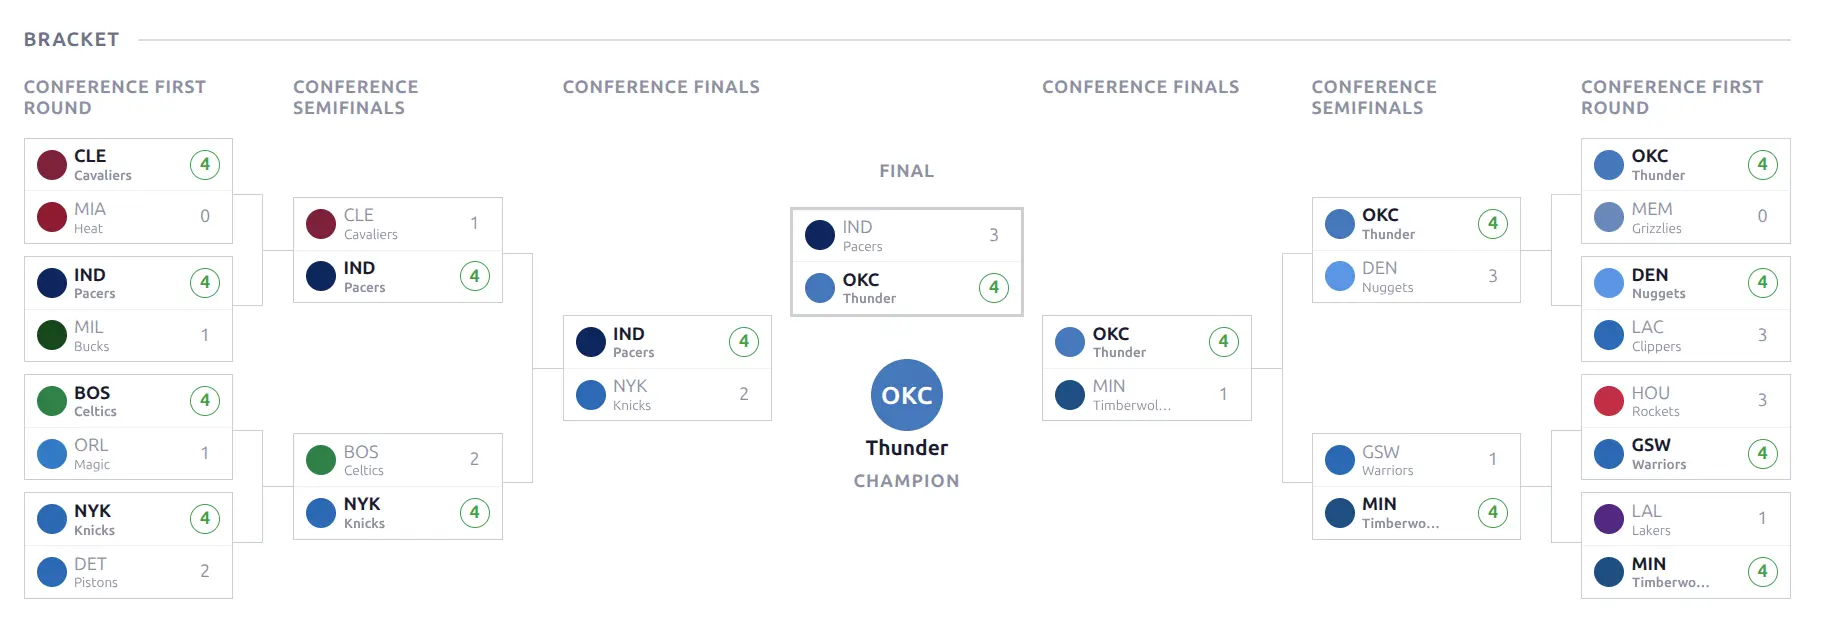
Cup Tree / Bracket
Playoff bracket visualization for knockout tournaments. Uses a mirror layout for 2-conference formats (like NBA Playoffs) with the bracket converging to a center Finals matchup.
- Mirror layout — Eastern Conference on the left, Western on the right (auto-detected)
- Linear fallback — for single-bracket tournaments
- CSS Grid connector lines between rounds
- Team logos and series scores
- Champion badge — centered circle with team logo and “CHAMPION” label
- Round headers (First Round, Semifinals, Conference Finals, Final)
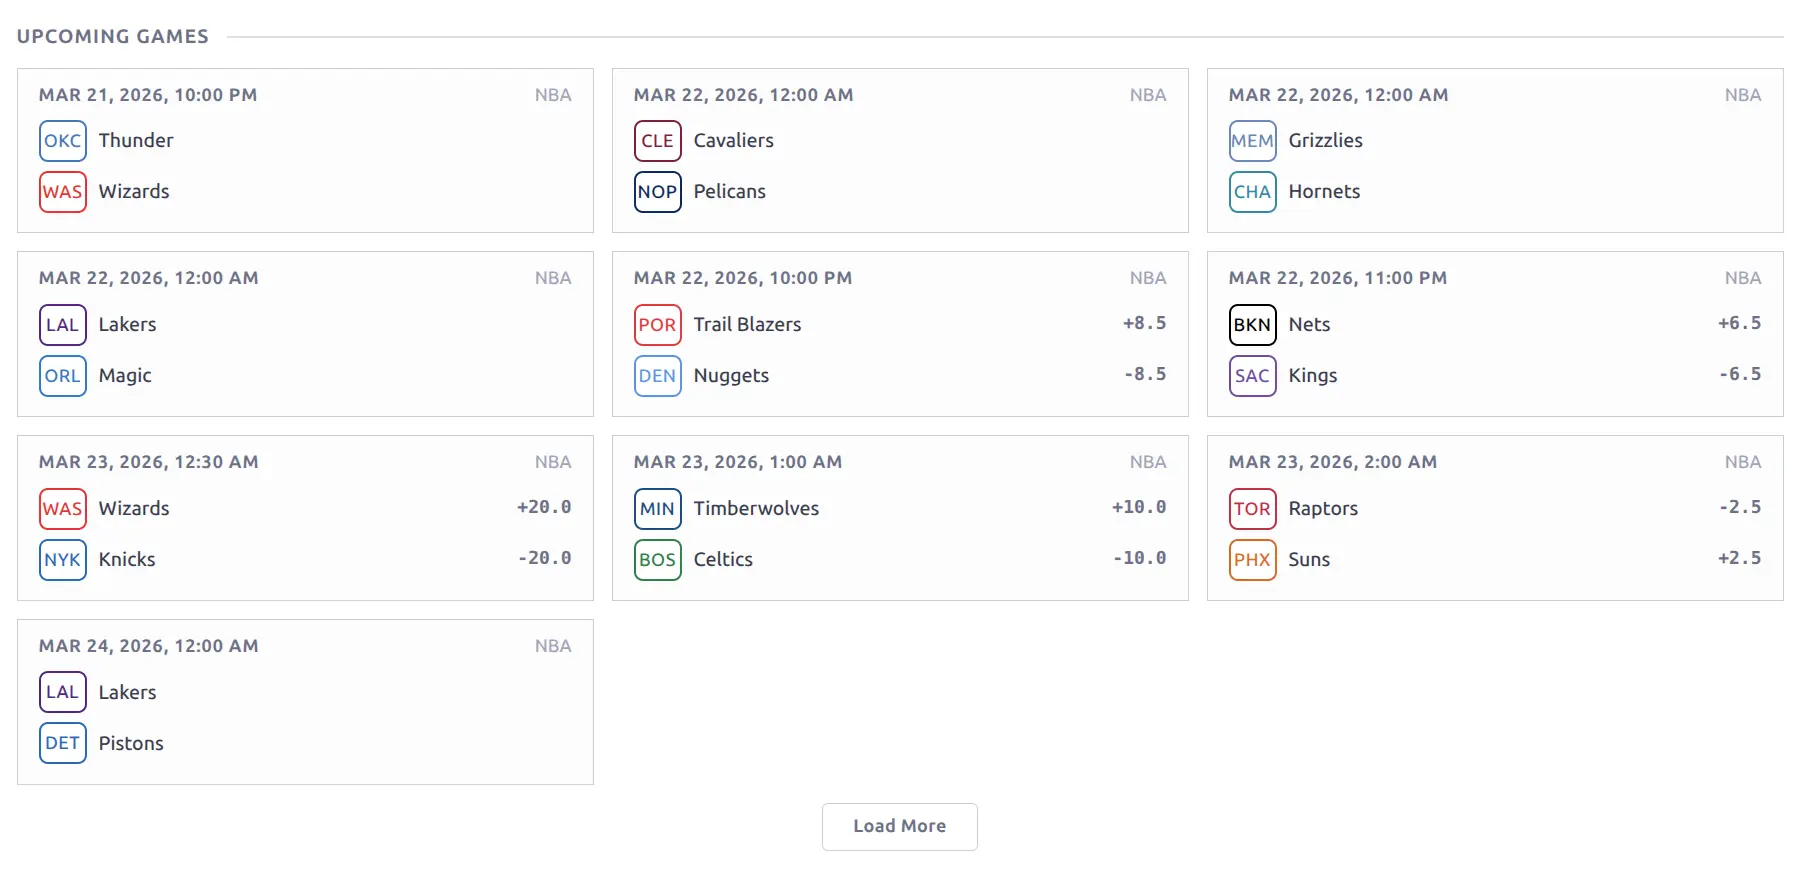
Upcoming Games
Scheduled games displayed as game cards in a responsive grid. Each card shows the date/time, league label, team badges and names, and point spread from odds data (when available). Times are automatically converted to the visitor’s timezone.
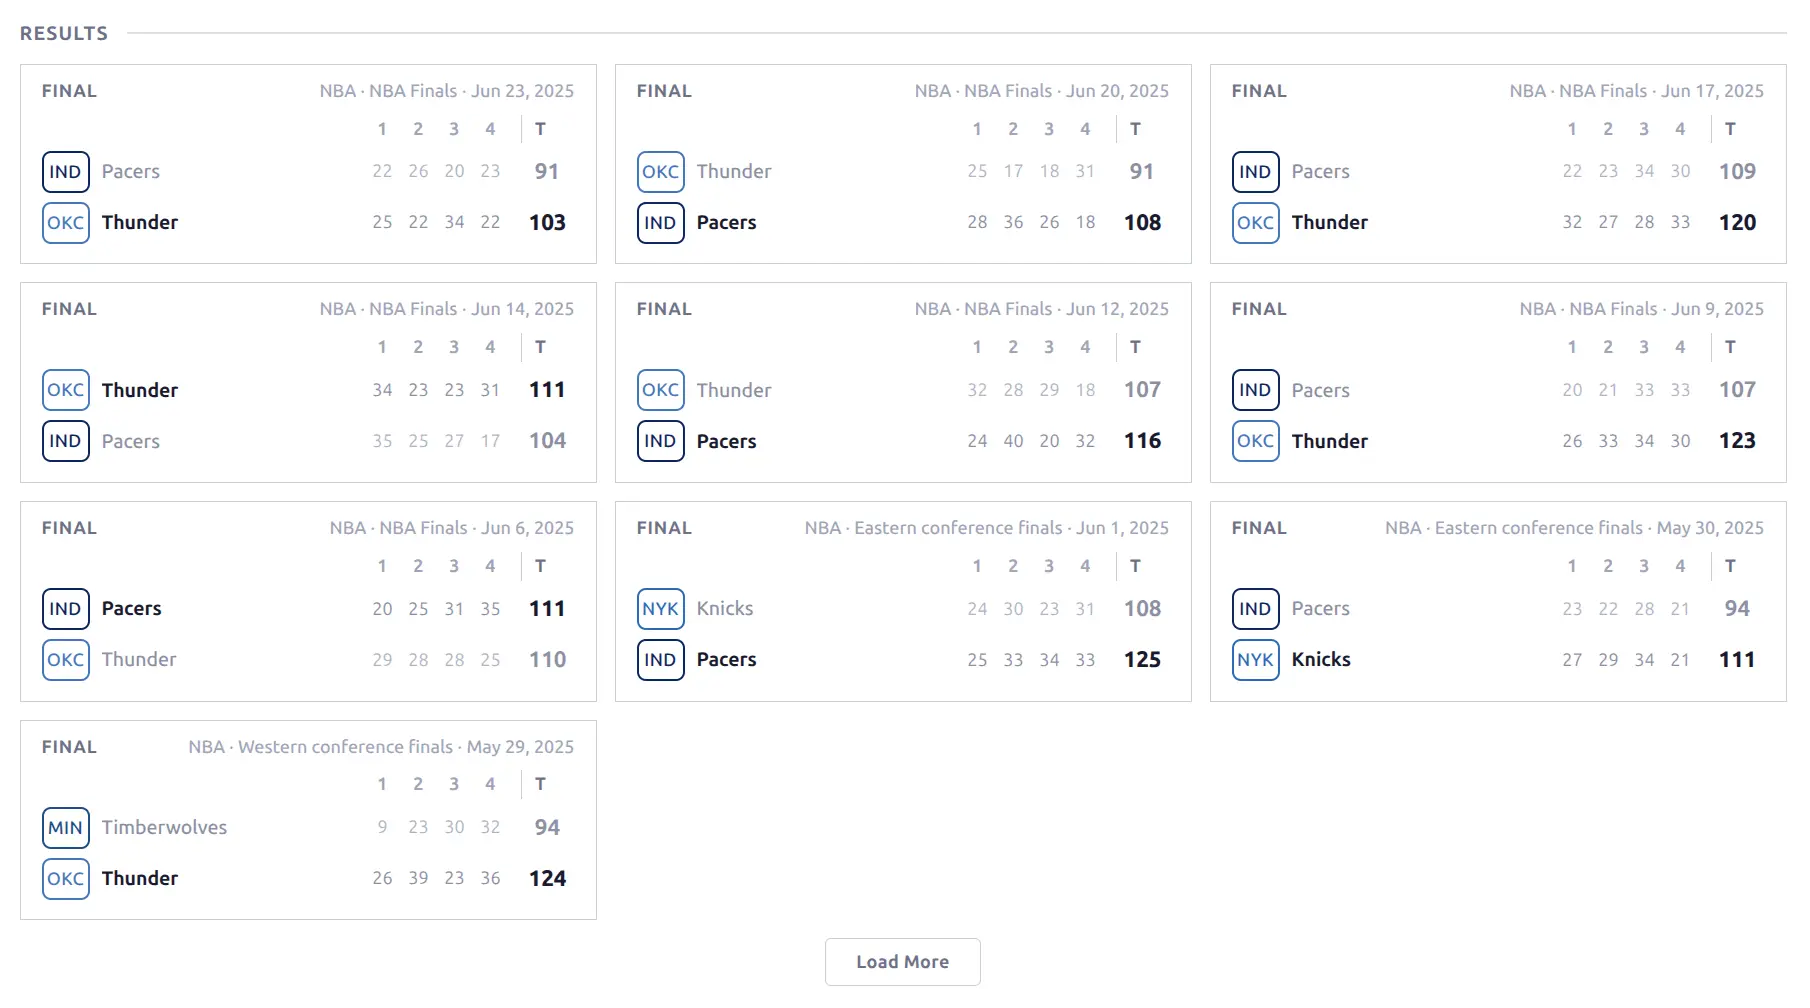
Results
Completed games displayed as game cards in a responsive grid. Each card shows the “FINAL” status, league and round labels, team badges and names, per-period scores, and total score with the winner in bold. A Load More button loads additional results.
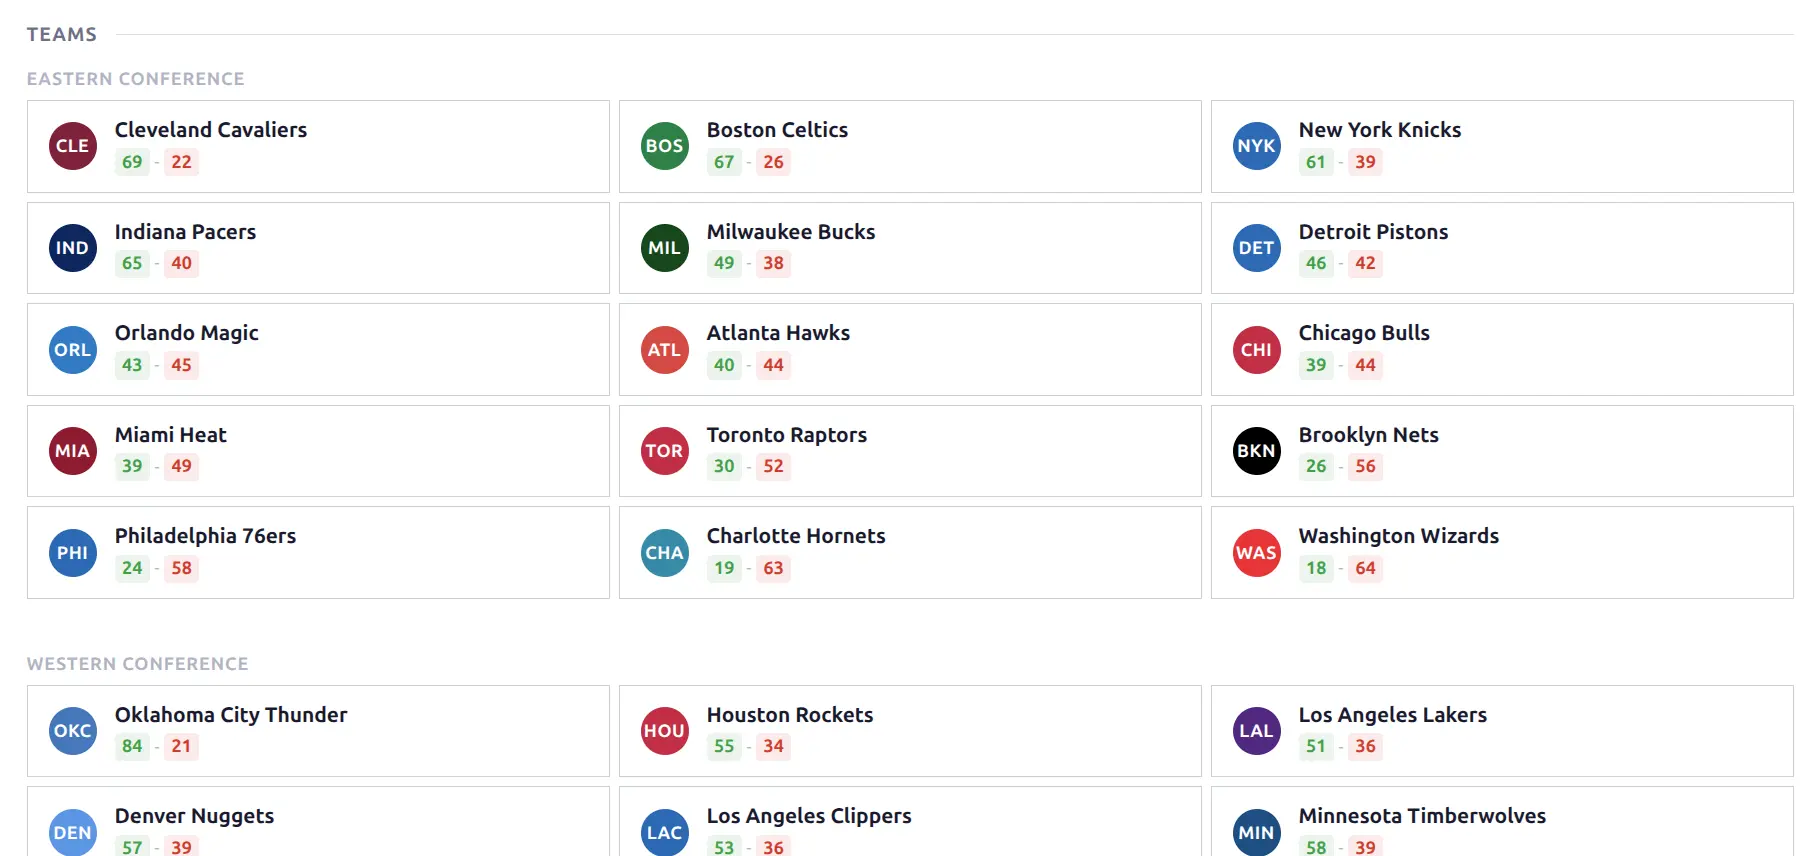
Teams
All teams in the season displayed as a card grid grouped by conference or division. Each card shows the team logo badge (colored circle with team code), full team name, and season W-L record. Cards link to the team page.
Scoreboard
A standalone date-navigated game browser for the season. Provides a more interactive, date-based way to browse all games compared to the Results/Fixtures blocks.
- Date navigation — pill-styled arrow buttons with a “Today” badge
- Status filter pills — Live, Finished, Upcoming (with smart disabling for empty states)
- Round dividers — group games by tournament round/stage
- Game cards in a fluid grid layout
- Content loaded via REST API — revisiting a date is instant (cached in memory)
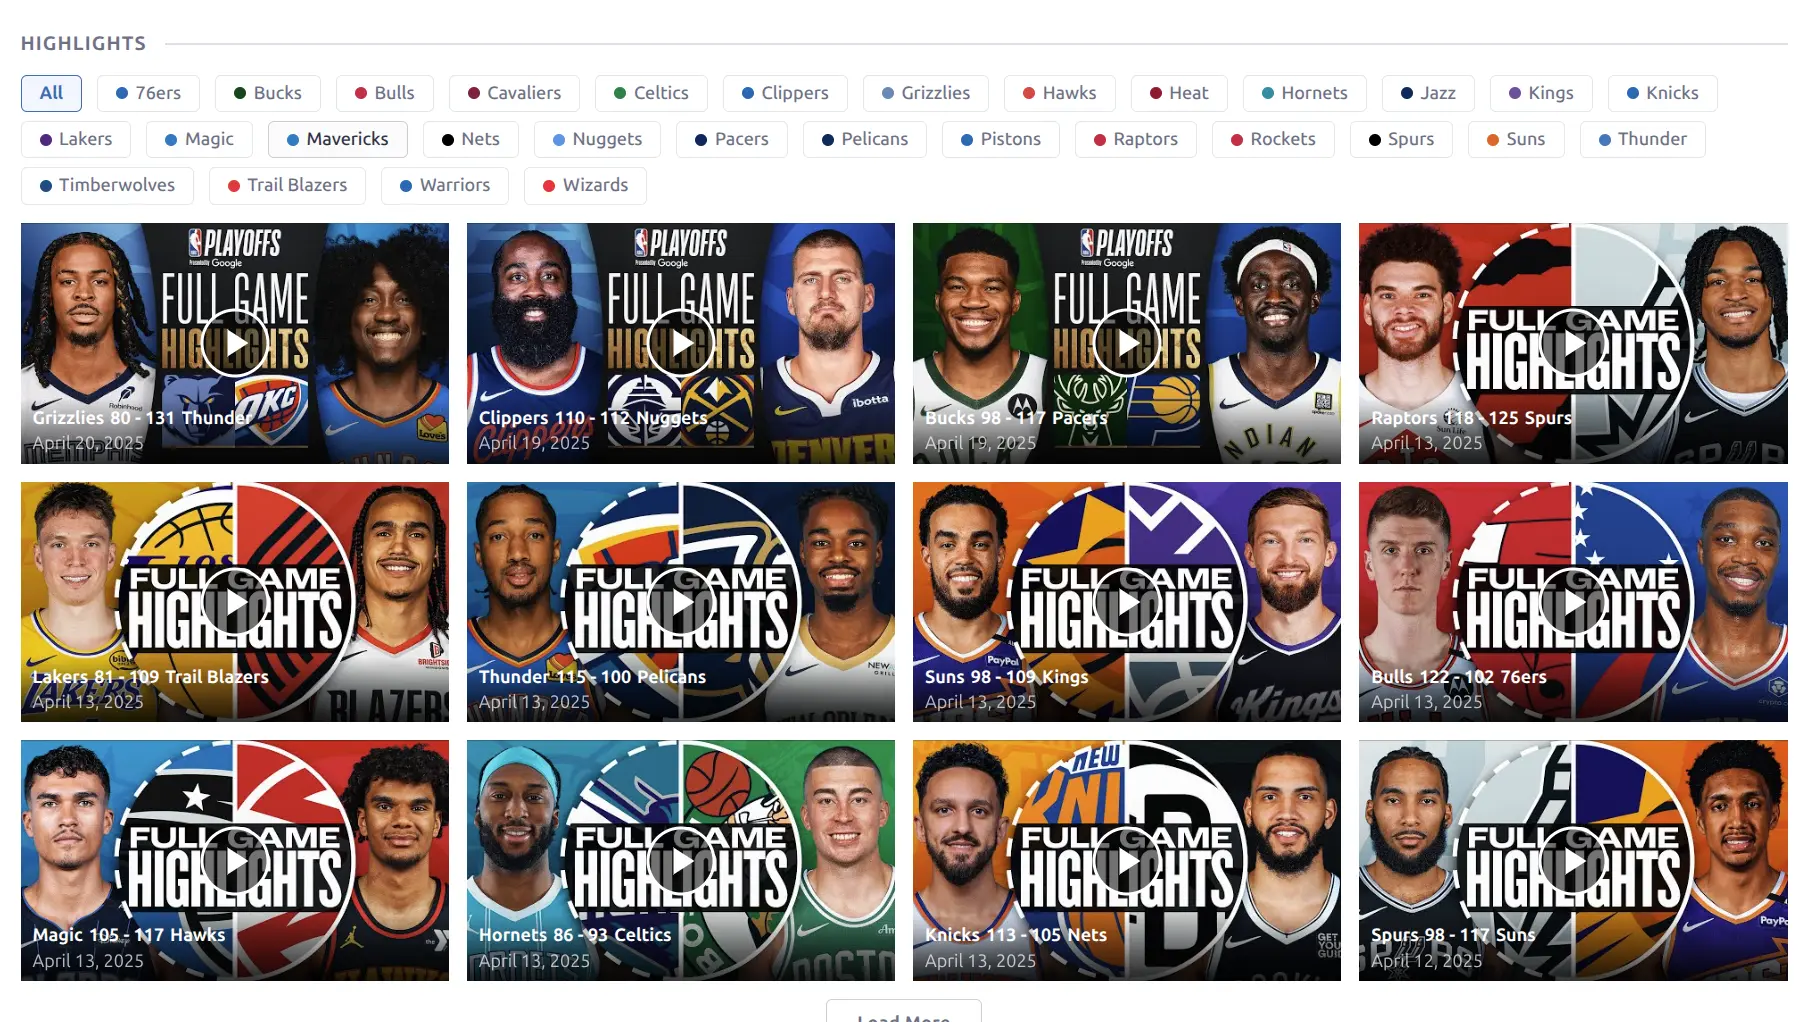
Highlights
YouTube video highlights from games in the season. Displayed as a responsive card grid with team filter pills at the top. Click any team name to filter videos to that team only. Each card shows the video thumbnail with a play button overlay, team logos, score, and date.
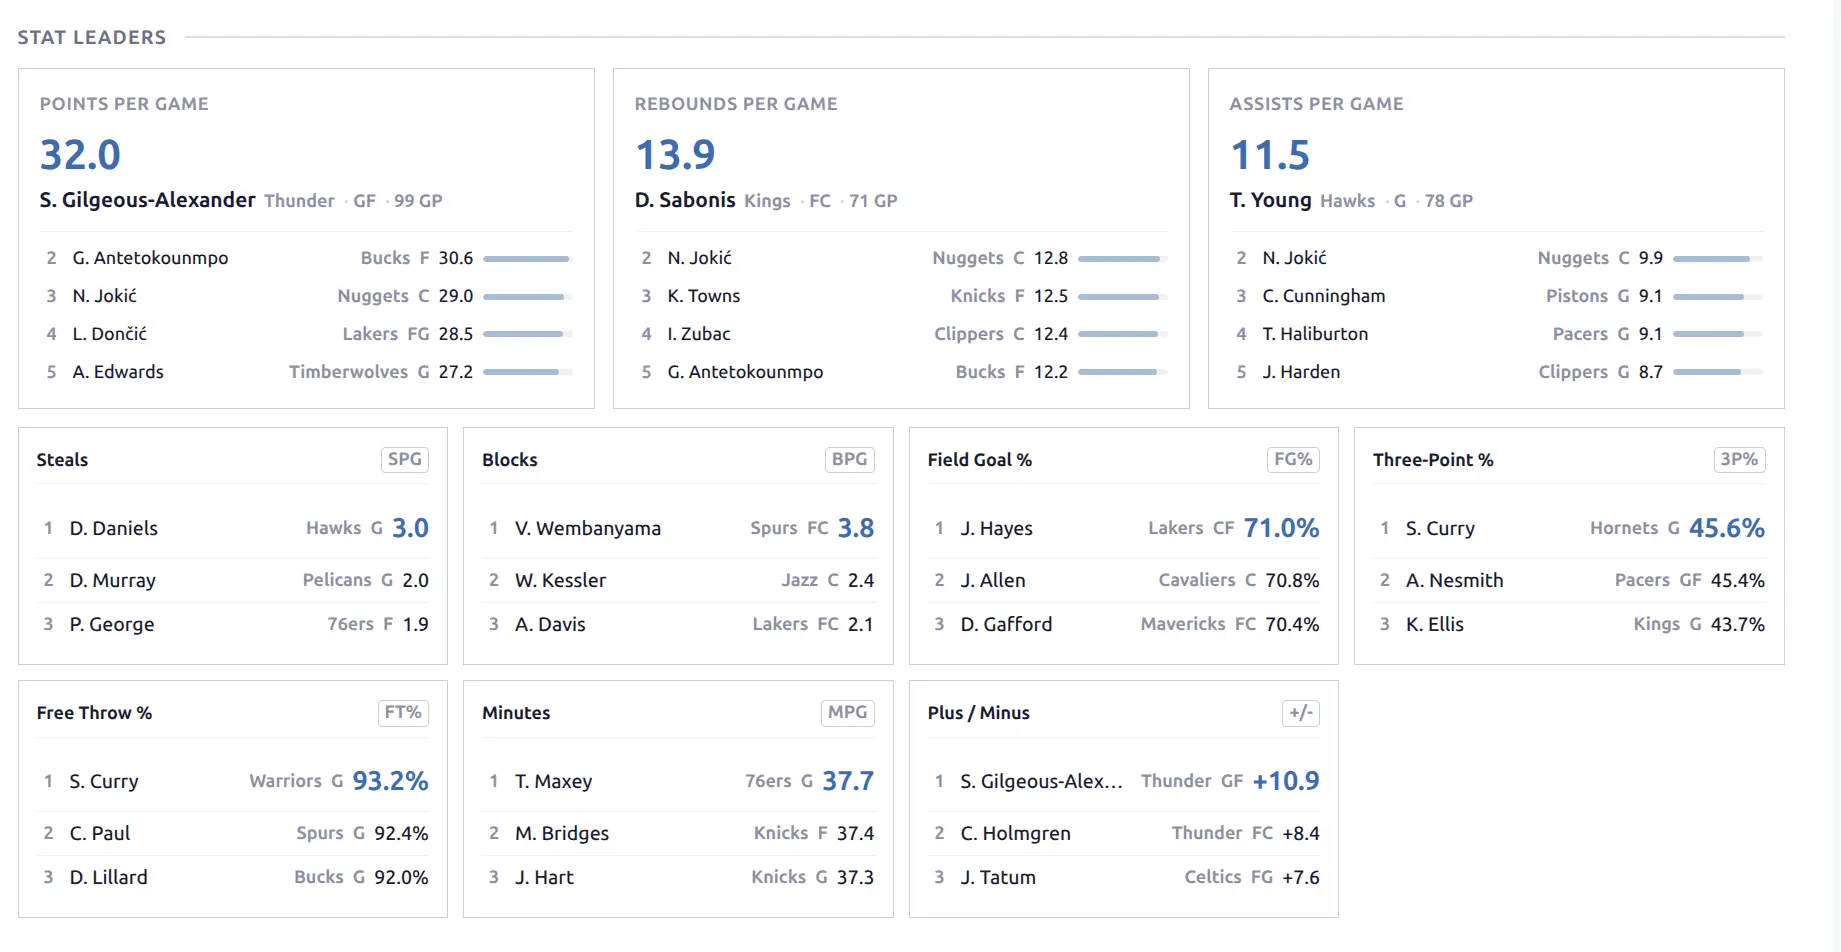
📊 Stat Leaders
Top performers across the league for key statistical categories.
Basketball: Hero cards for the top 3 categories (Points Per Game, Rebounds Per Game, Assists Per Game) — large cards showing the leader’s name, team, and stat value, with the top 5 players listed below. A compact grid shows additional categories: Steals, Blocks, Field Goal %, Free Throw %, Three-Point %, Minutes, Plus/Minus.
Baseball: Separate batting and pitching leader sections.
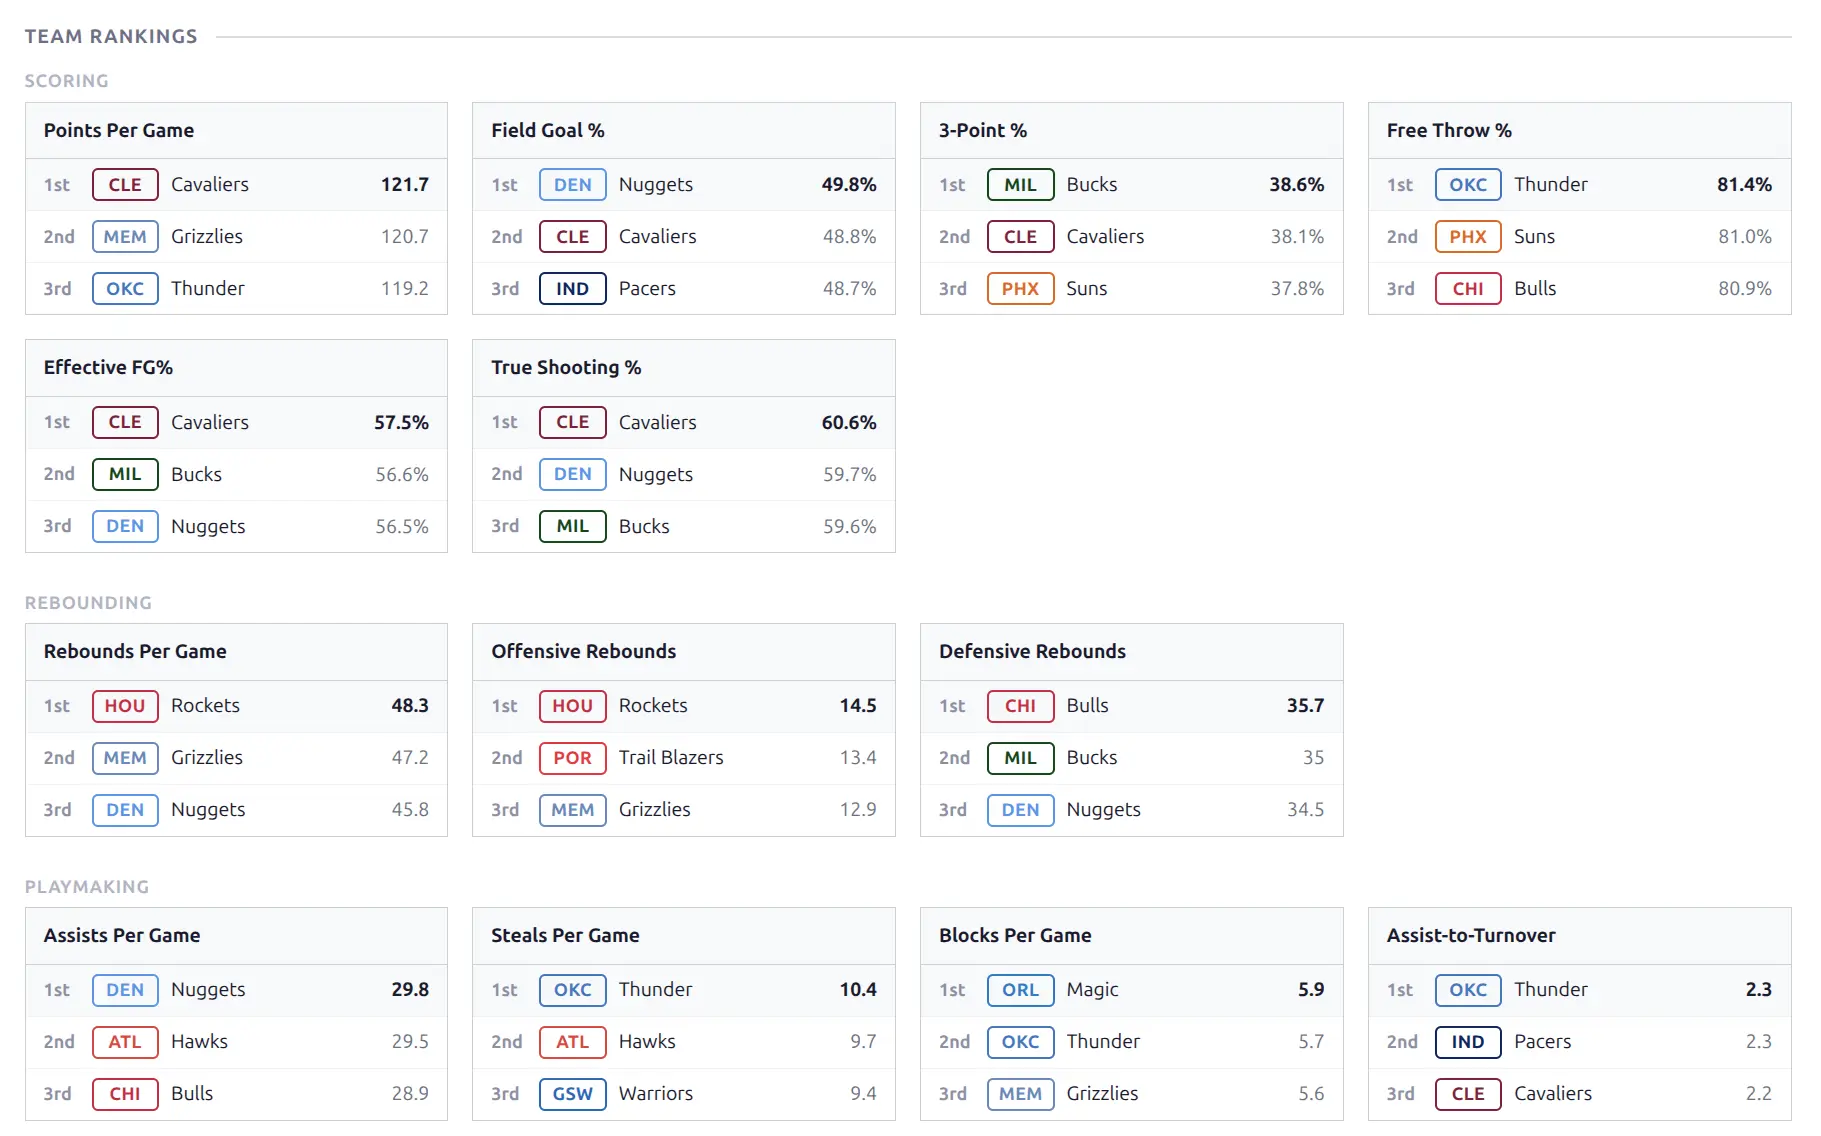
Team Rankings
League-wide team rankings for every statistical category, organized by theme (Scoring, Rebounding, Playmaking for basketball). Each card shows the top 3 teams with rank position, team badge, name, and stat value.
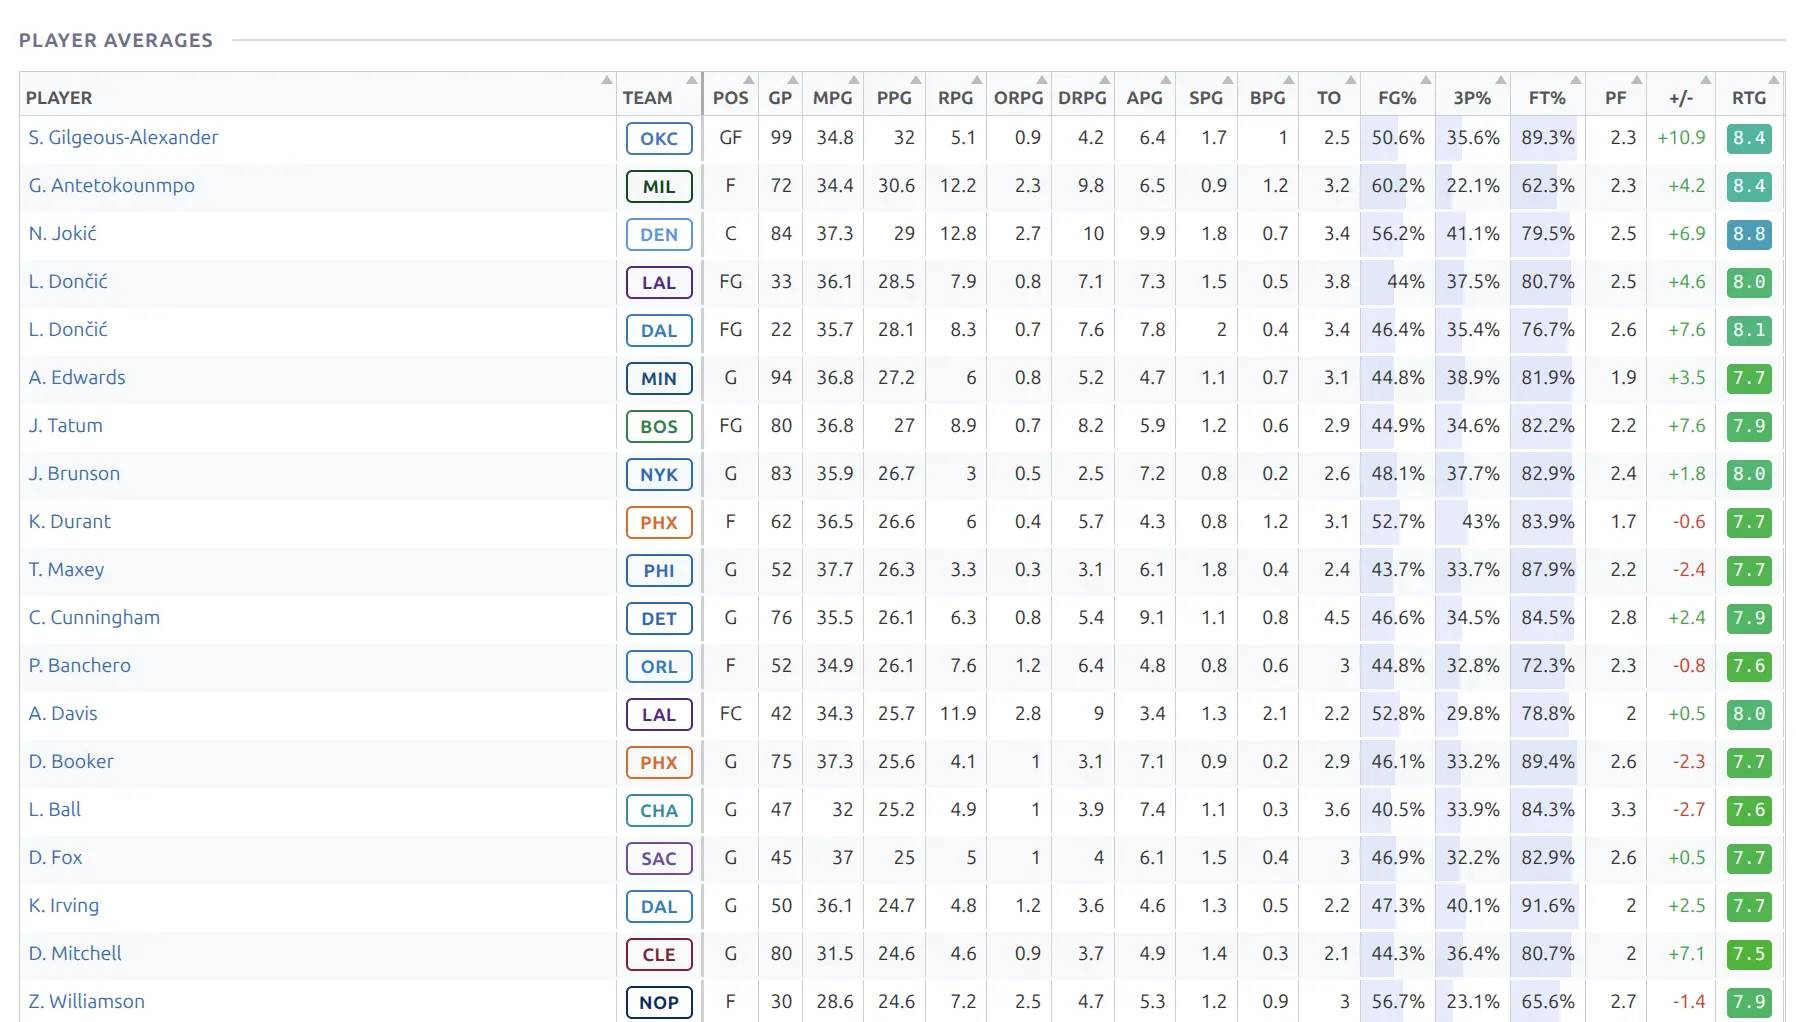
Player Averages
A full-width sortable table showing per-game averages for all qualifying players in the league. Click any column header to sort. The player column is frozen for horizontal scrolling.
Basketball columns: GP, MPG, PPG, RPG, APG, SPG, BPG, TO, FG%, 3P%, FT%, PF, +/-, RTG
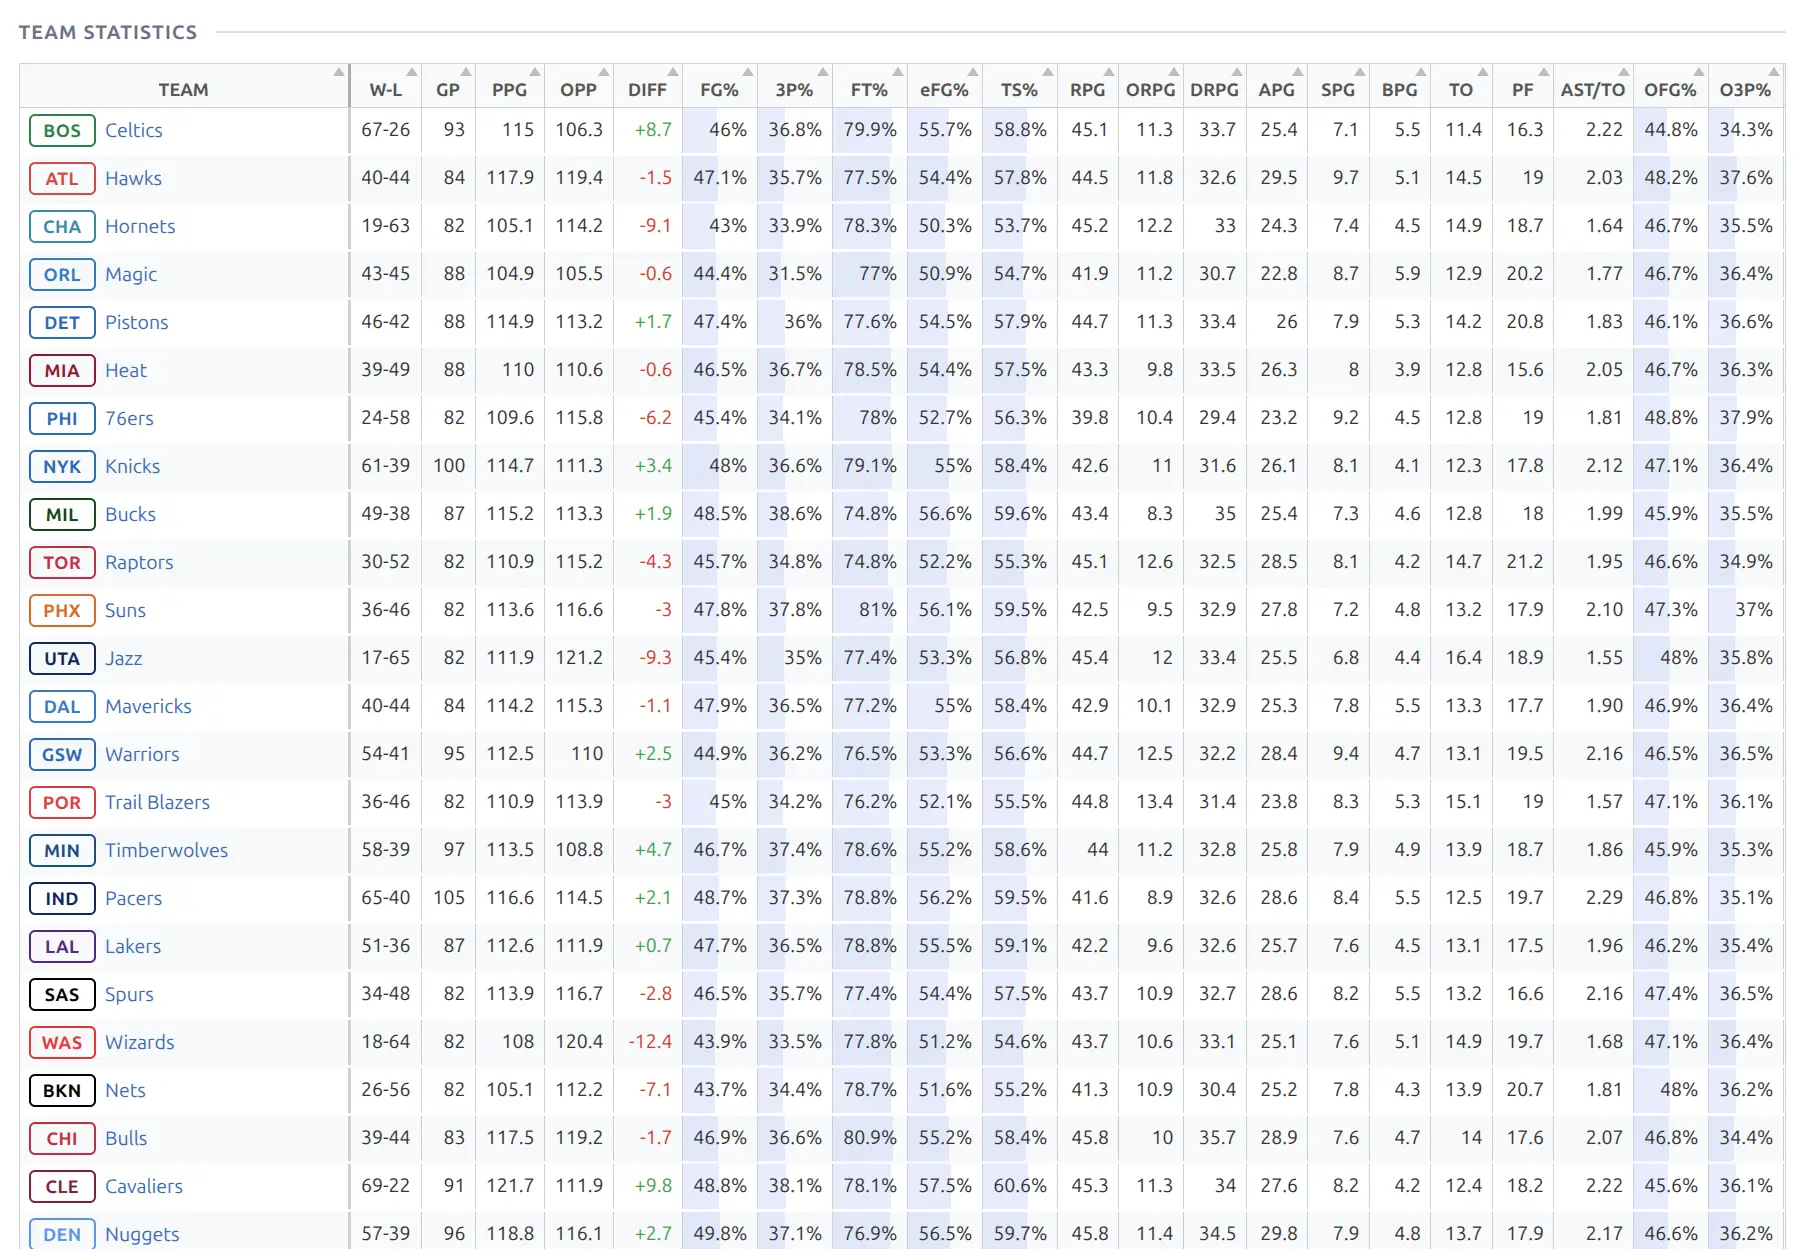
Team Statistics
A full-width sortable table comparing all teams across every statistical category. The most comprehensive statistical comparison available — every team and every stat in one table. The team column is frozen for horizontal scrolling, with color-coded values highlighting relative performance.
Description
Custom content from the WordPress post editor. Useful for adding season previews, editorial commentary, or notes. Edit from the season’s post in Hub Data > Seasons.
🛠️ Layout Example
The default basketball season layout arranges all blocks with a sticky navigation bar at the top for quick access to different sections.
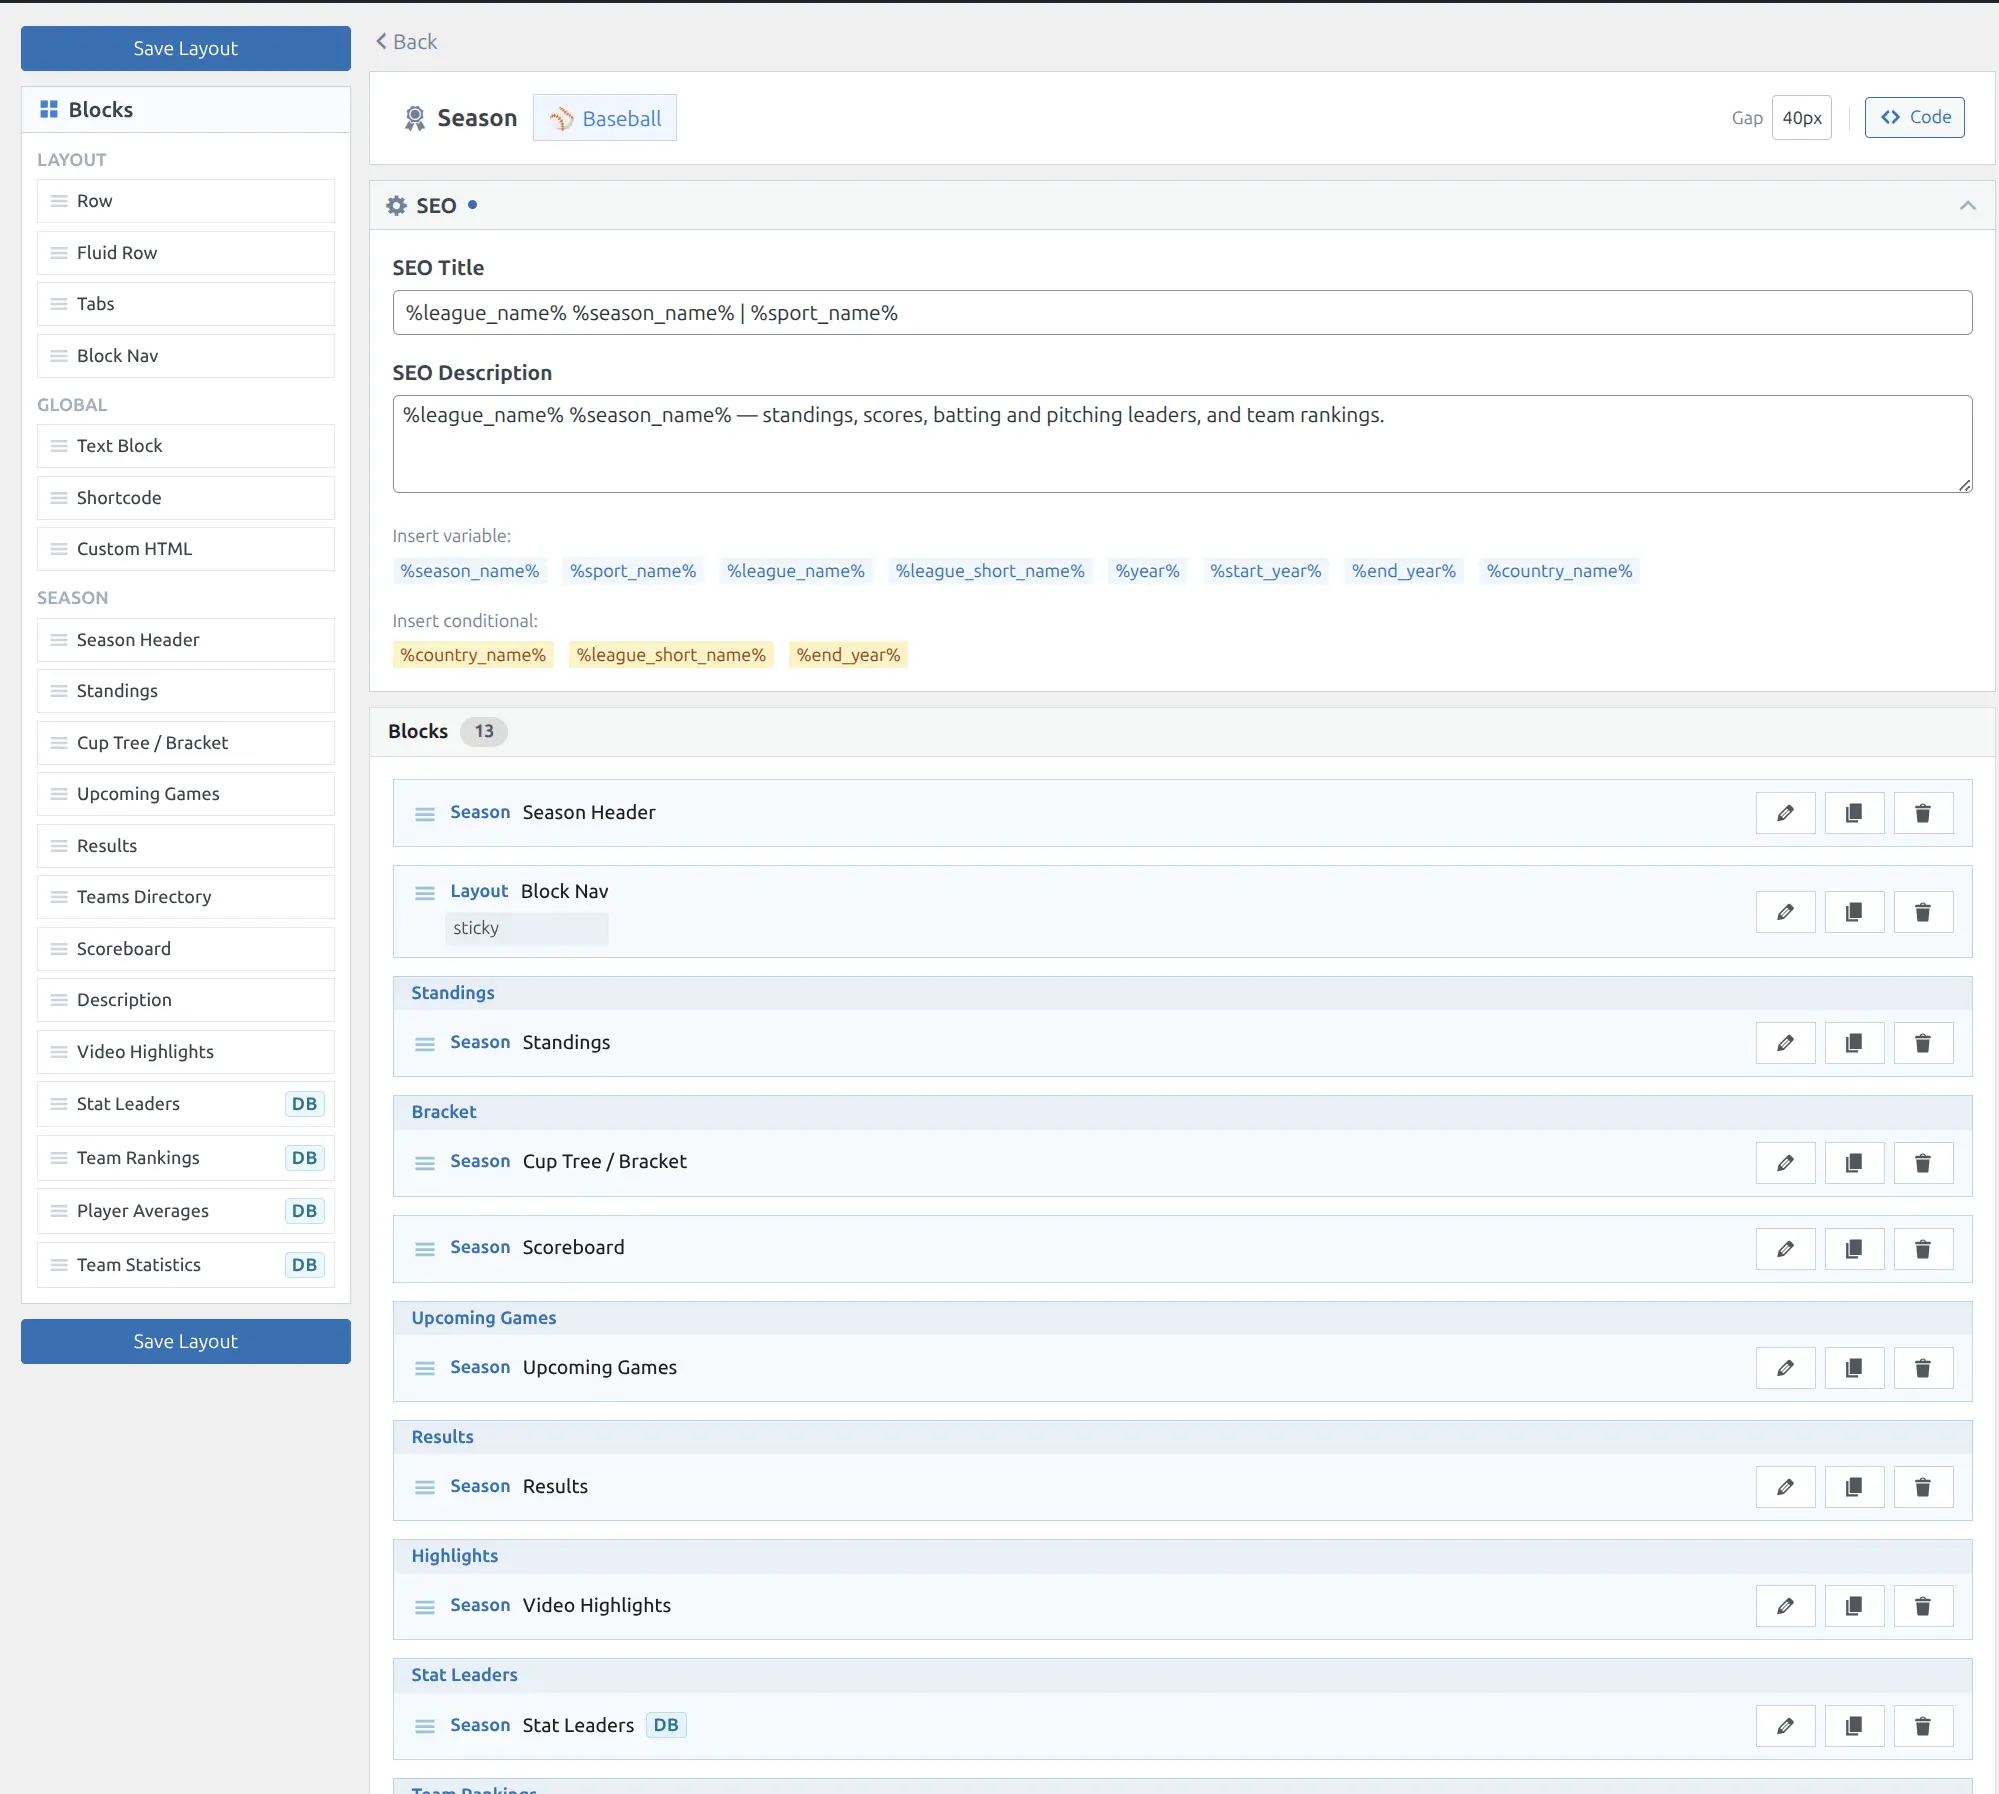
The sidebar shows all available blocks grouped by type (Layout, Global, Season). Drag blocks to add or reorder them. Each block can be configured with custom headers, spacing, and styling. See the Layout Builder guide for full customization options.
Tip
Add a Block Nav (from the Layout group) at the top of your season layout. It automatically generates a sticky navigation bar with links to each block section — visitors can jump to Standings, Bracket, Leaders, etc. with one click.
📚 Related
- Layout Builder — Arrange and customize blocks on season pages
- Team Pages — Team profiles linking from standings and teams blocks
- Player Pages — Player profiles linking from averages and leaders
- Shortcodes — Standalone shortcodes for standings, bracket, scoreboard, and leaders