

Game pages display all available data for a single game — scores, stats, play-by-play, charts, and pre-game analysis. The page is built from blocks that you arrange using the Layout Builder. Each game has three separate layouts — one for each game state — so you can show different content depending on whether the game is upcoming, live, or finished.
Three Game State Layouts
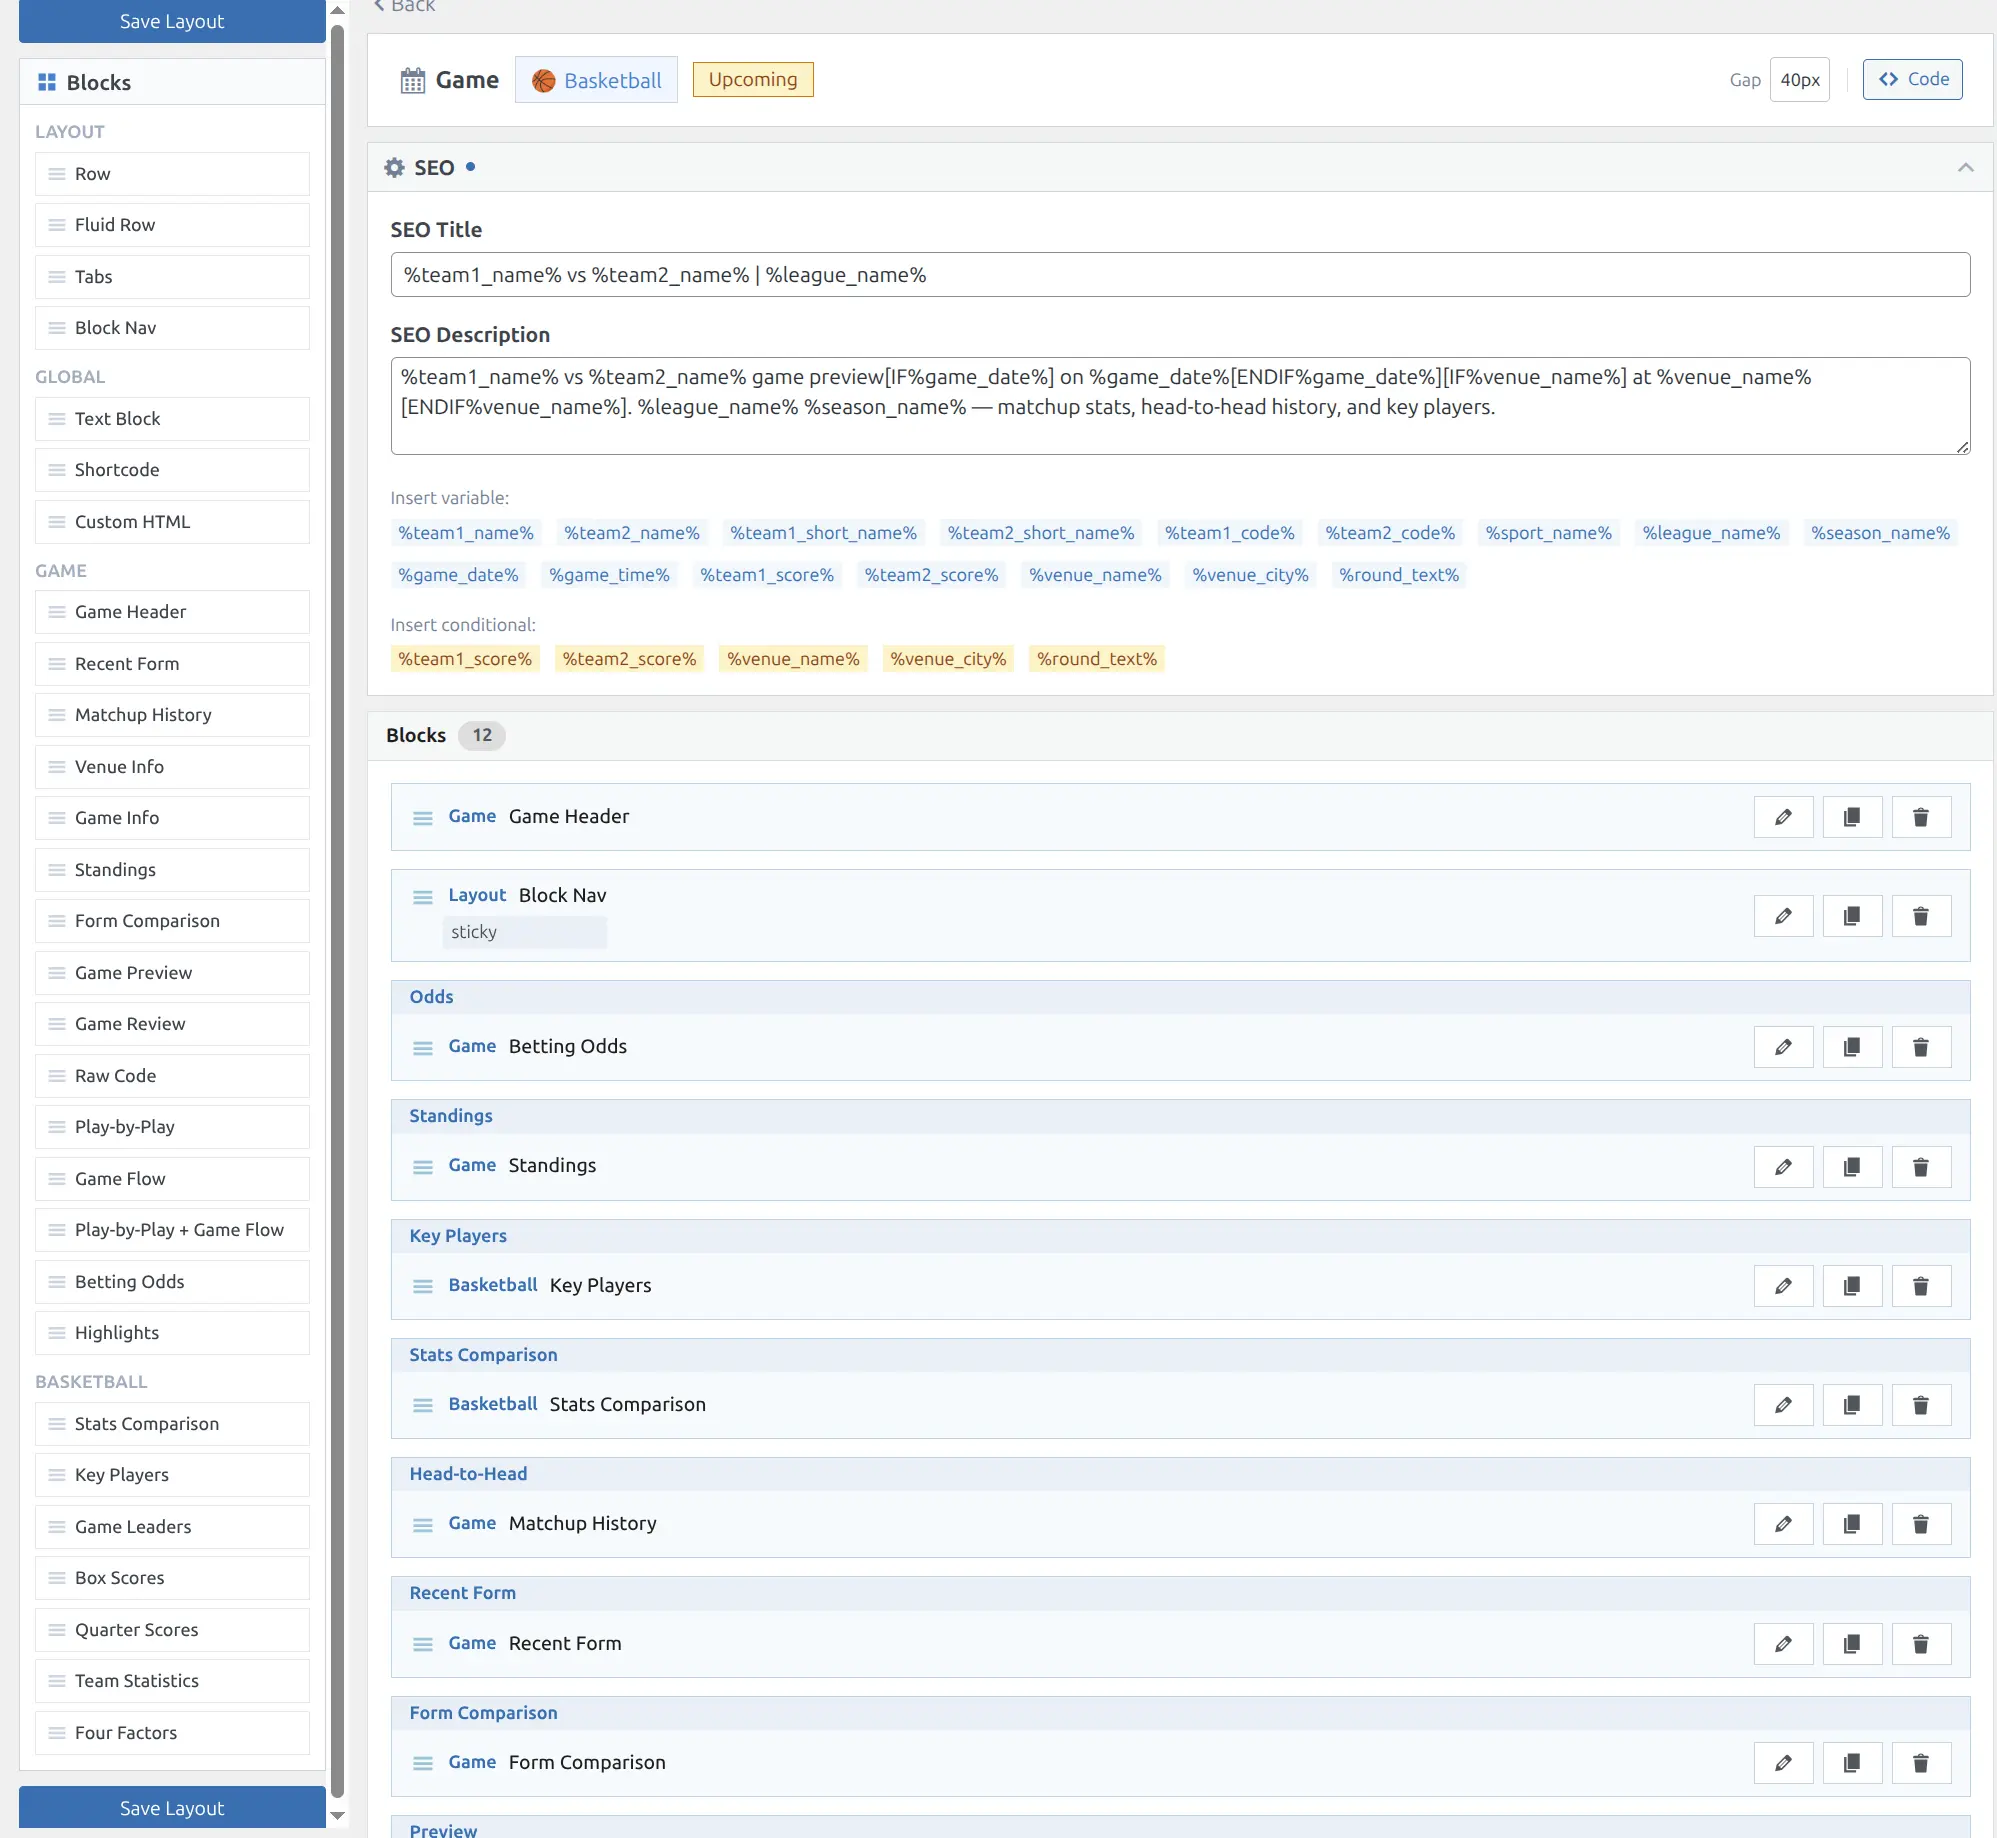
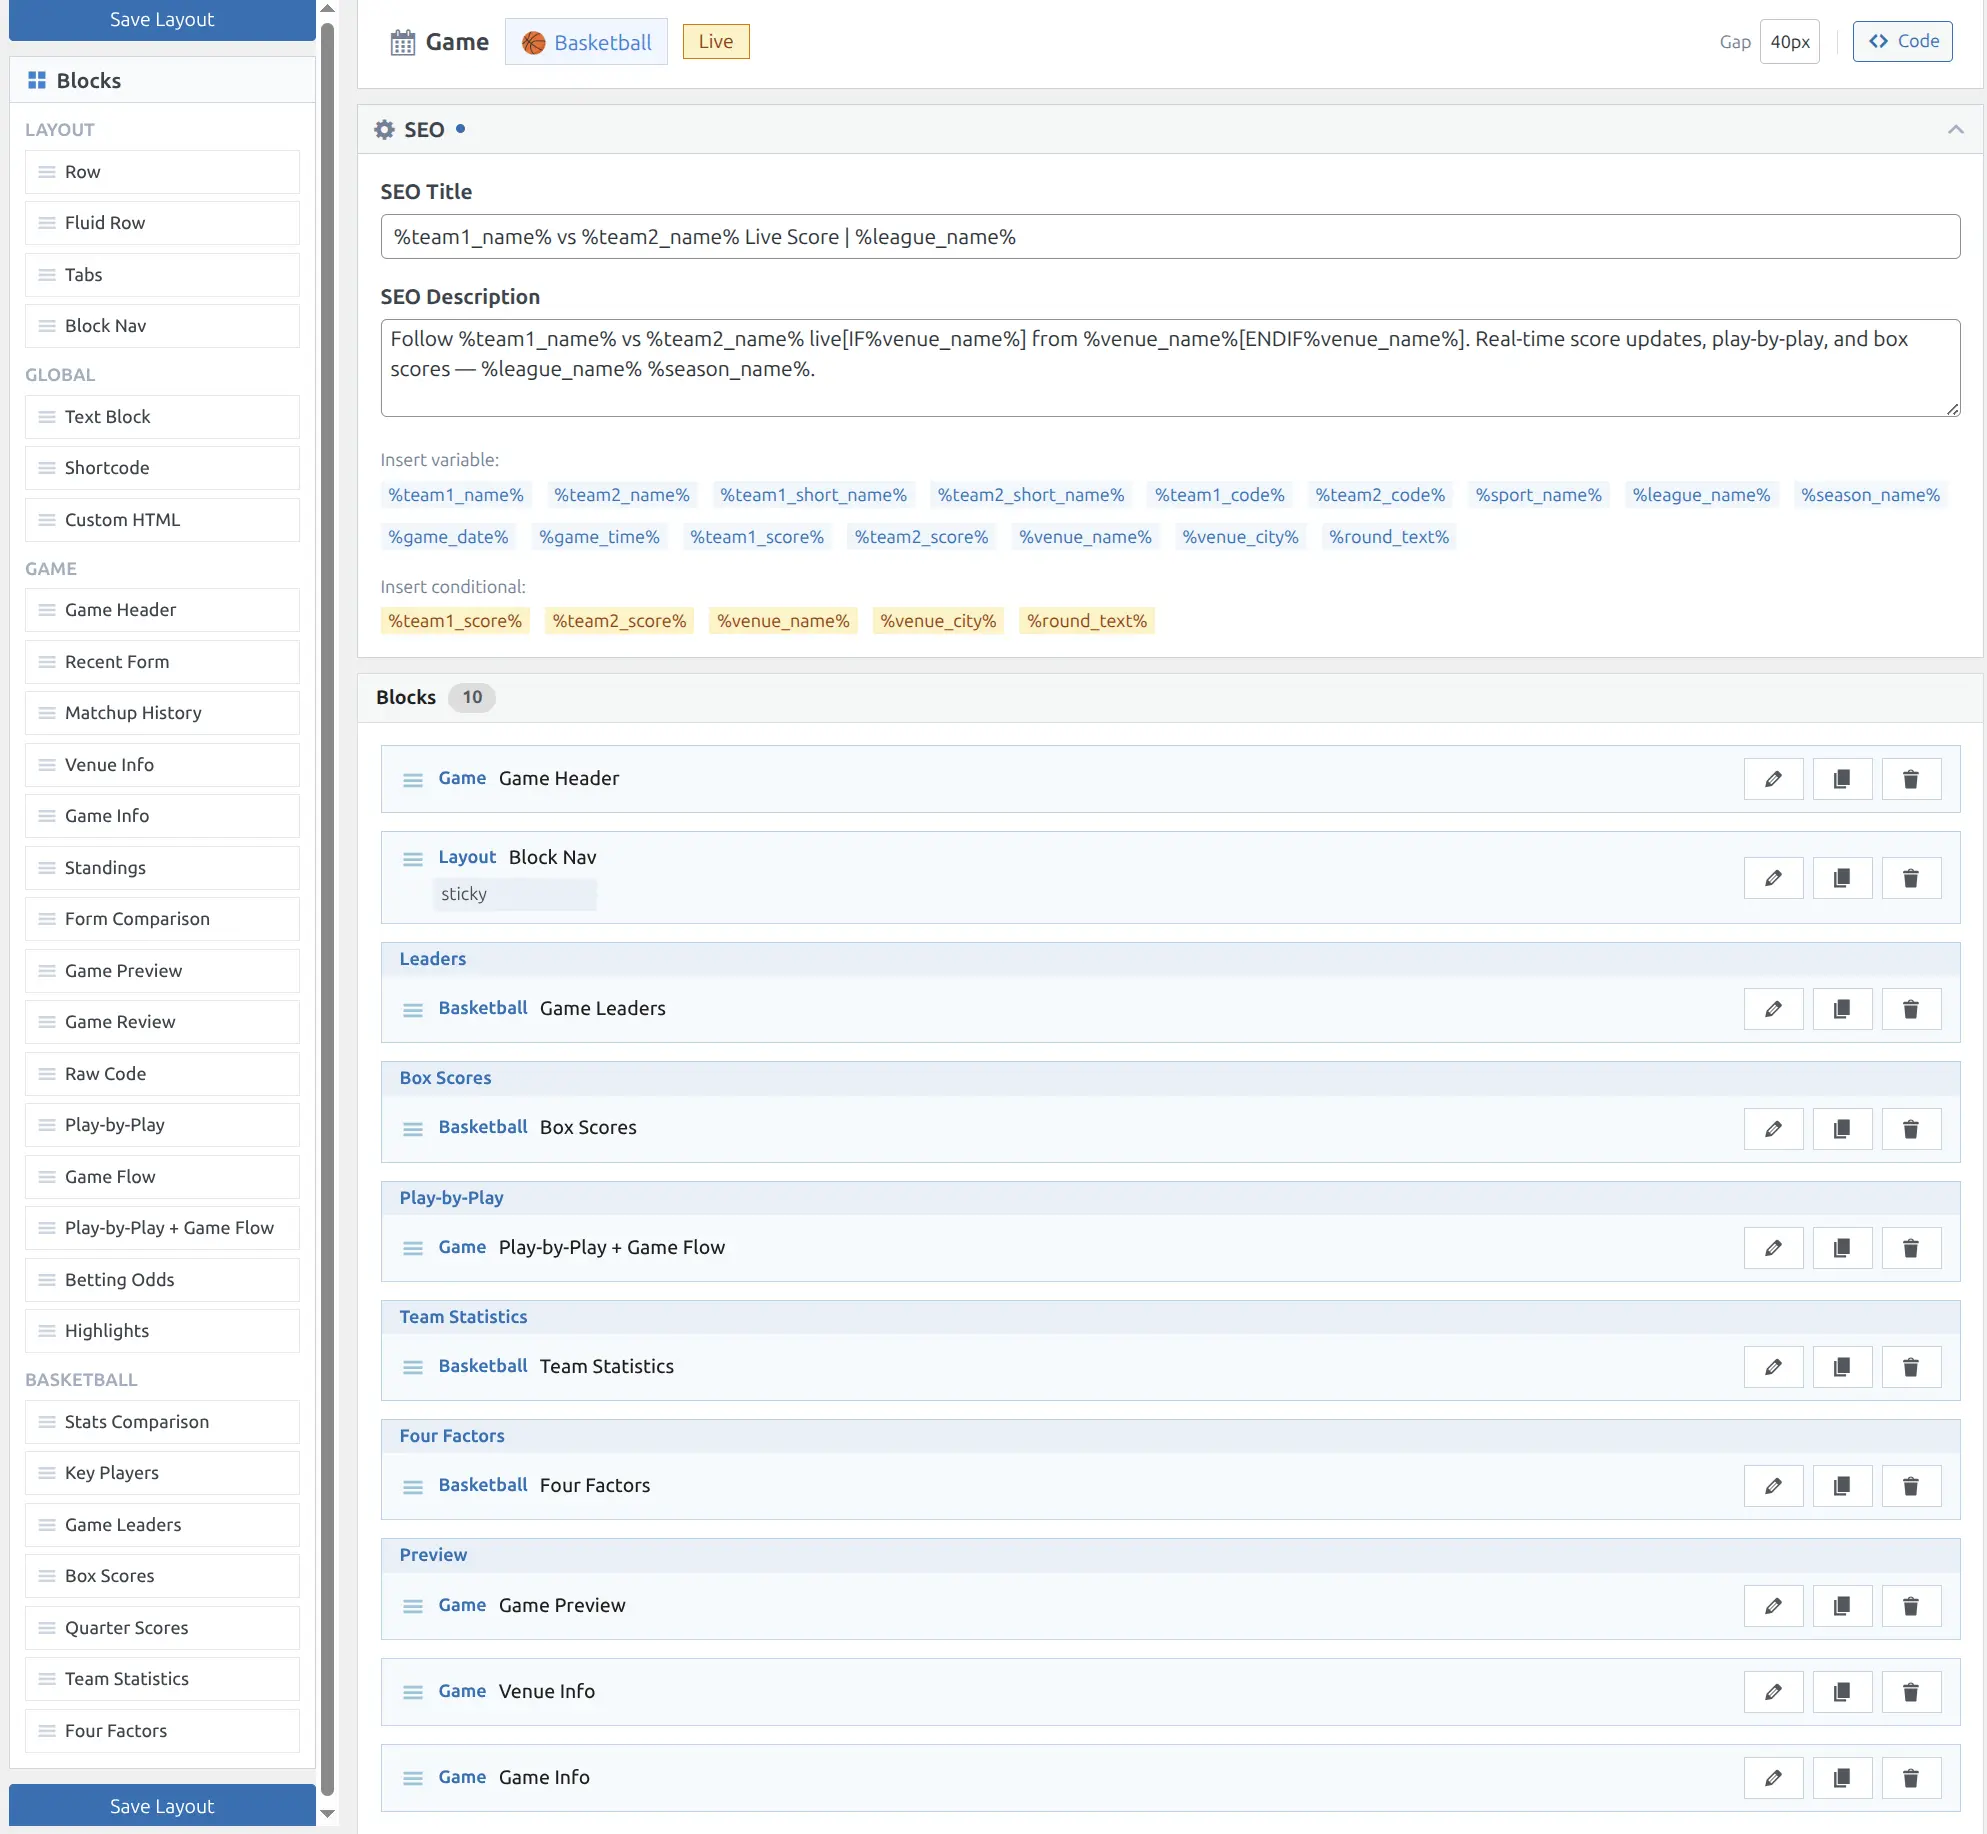
The Layout Builder provides a dedicated layout for each game state. You can choose exactly which blocks appear in each state:
- Upcoming — Pre-game analysis: odds, standings, key players, stats comparison, head-to-head, recent form, form comparison
- Live — In-progress data: box scores, play-by-play, game flow charts, team statistics, leaders
- Finished — Post-game recap: leaders, box scores, play-by-play + game flow, team statistics, four factors, matchup history, highlights
When a game transitions between states (e.g., from upcoming to live), the page automatically swaps layouts without a full page reload.
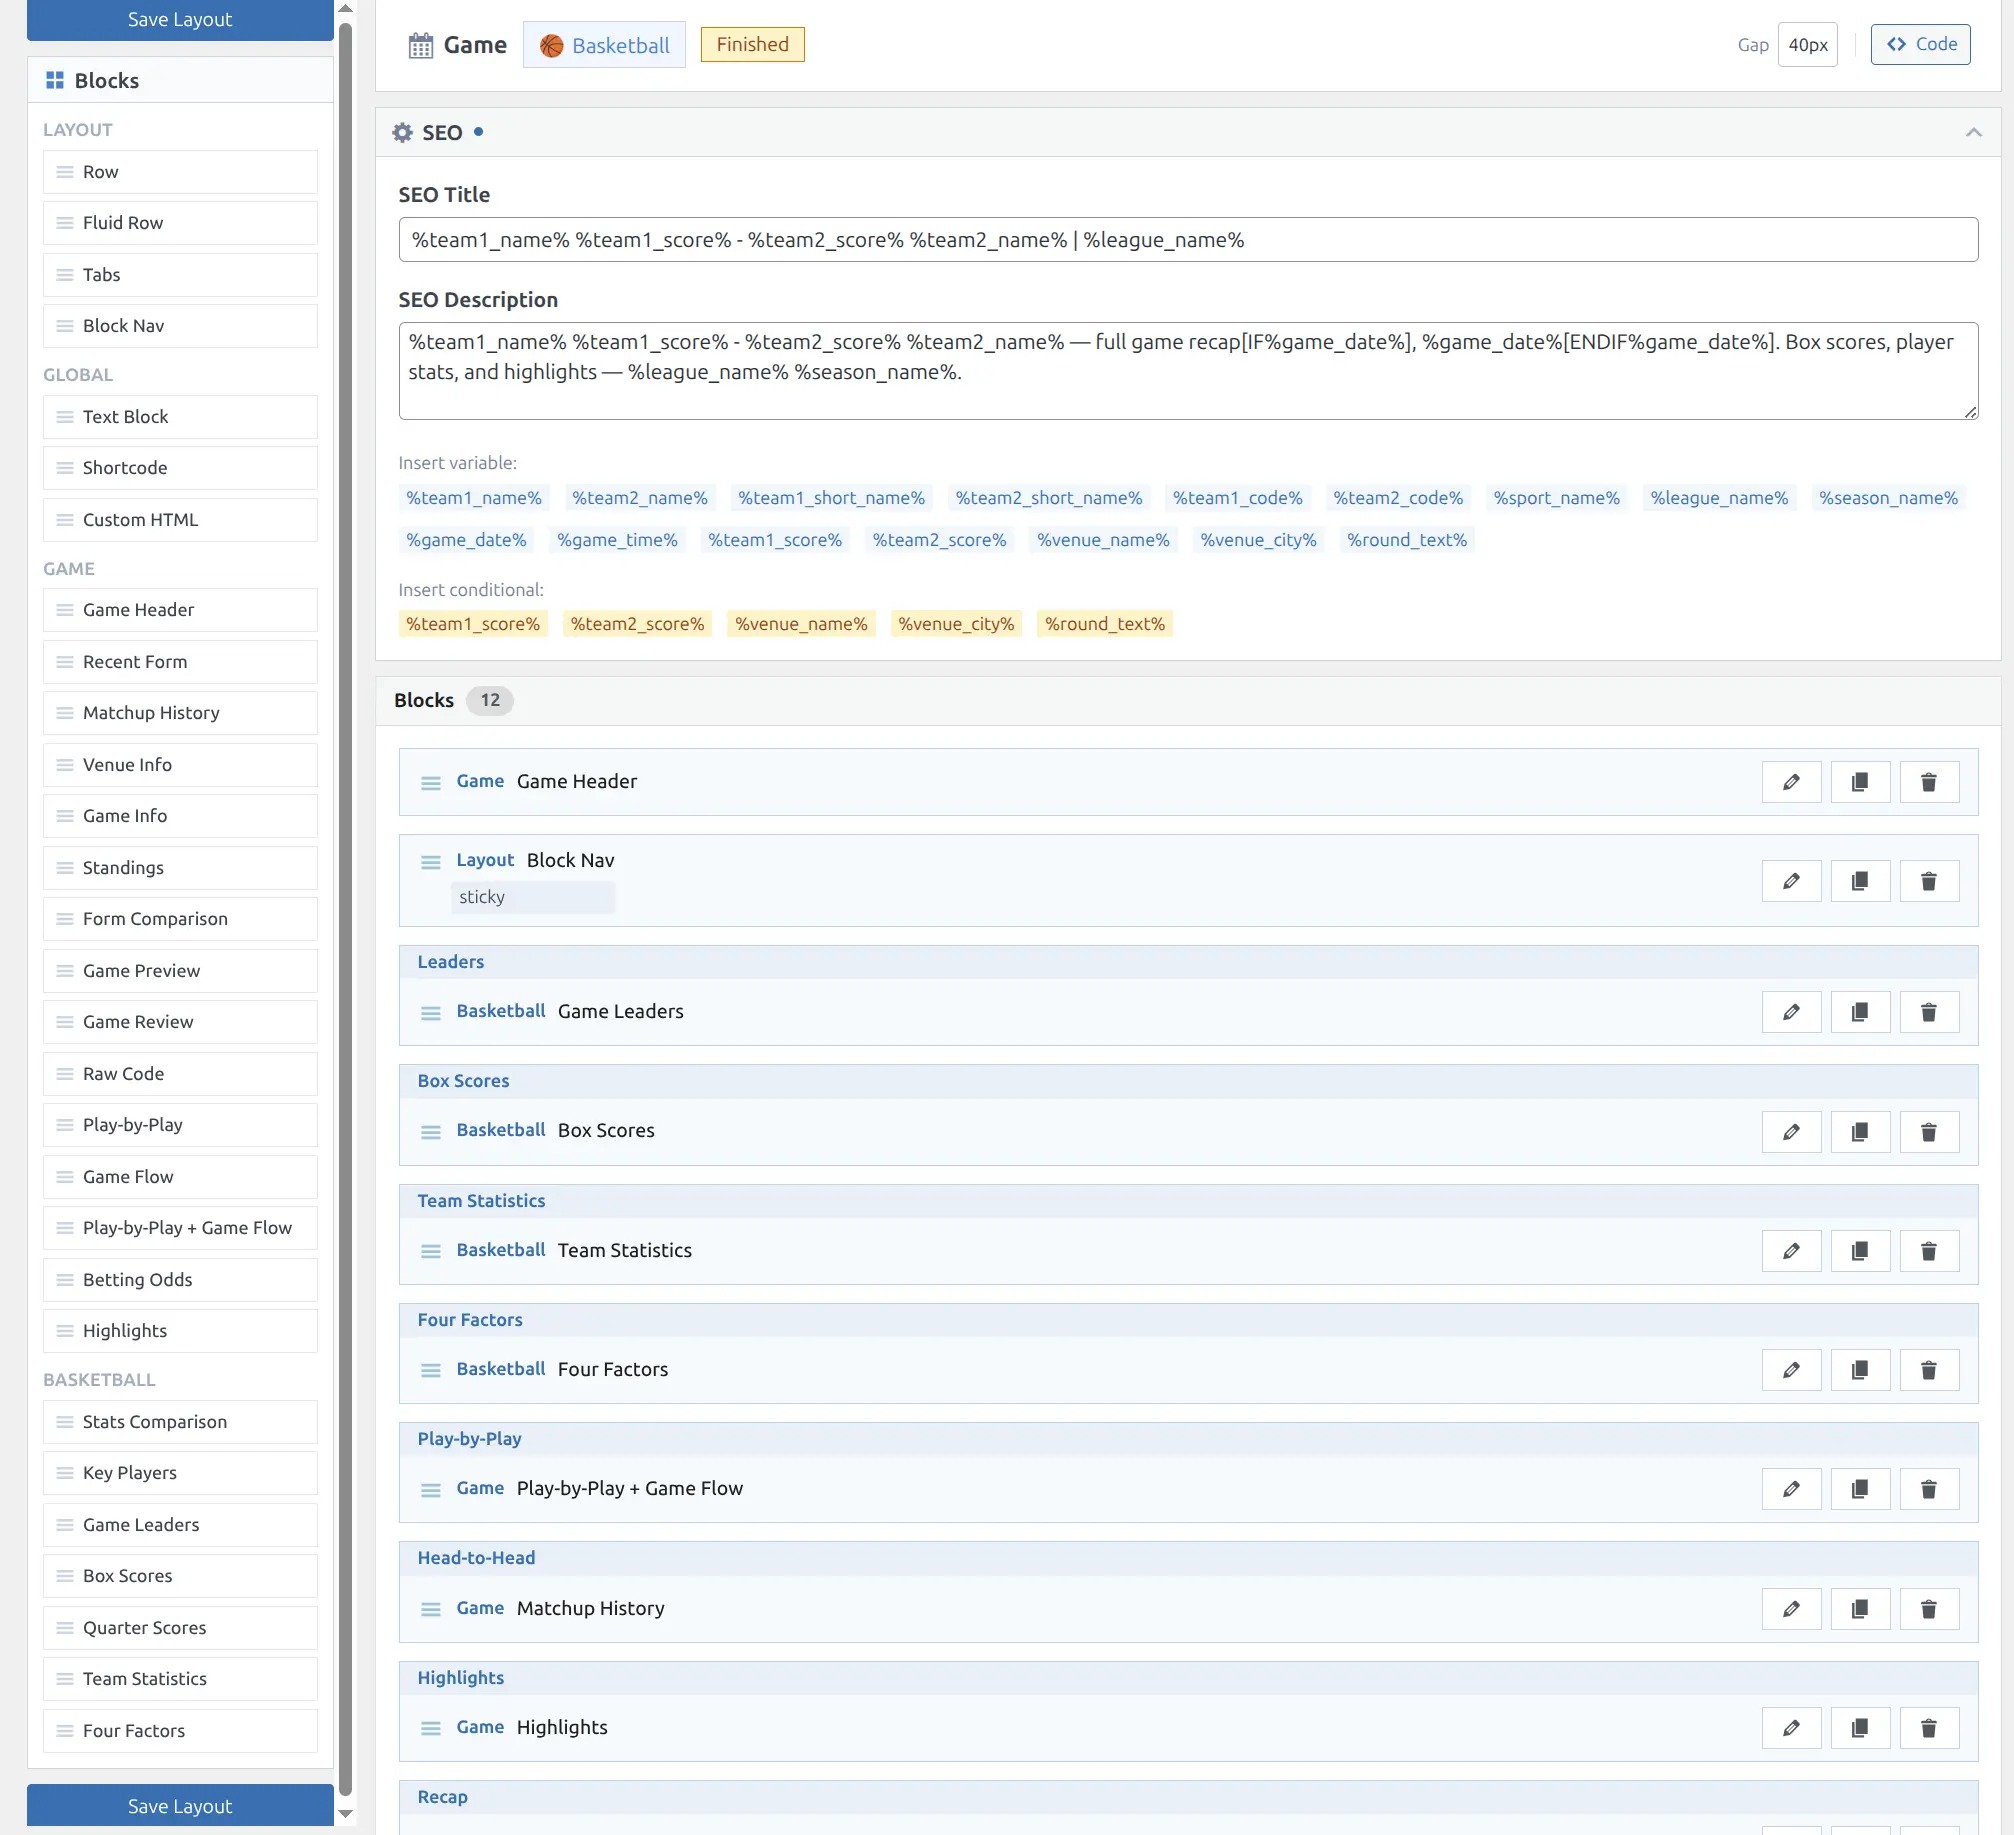
Available Blocks
Post-Game Blocks
| Block | Description | Data Required |
|---|---|---|
| Game Header | Scoreboard with team info, periods, records | Basic game data |
| Game Leaders | Top performers in 3 stat categories | Player Stats (P) |
| Box Scores | Per-player statistics tables | Player Stats (P) |
| Team Statistics | Side-by-side team stat comparison with bars | Team Stats (T) |
| Four Factors | Basketball efficiency metrics (eFG%, TOV%, ORB%, FT Rate) | Team Stats (T) |
| Play-by-Play | Chronological event log | Events (E) |
| Game Flow | Score progression + lead tracker charts | Events (E) |
| Play-by-Play + Game Flow | Combined timeline and charts side by side | Events (E) |
| Odds | Spread, moneyline, totals with format switcher | Odds data |
| Highlights | YouTube video highlights | Highlights (H) |
| Venue | Stadium info — name, city, capacity | Basic game data |
| Game Info | Metadata grid — league, season, date, time | Basic game data |
Pre-Game Blocks
These blocks show data to help visitors preview an upcoming game. All pre-game blocks automatically filter stats to before the game’s kickoff time, so the data is accurate whether viewed before or after the game.
| Block | Description |
|---|---|
| Stats Comparison | Radar chart + comparison bars with league ranks |
| Key Players | Top players per team by season averages |
| Recent Form | Last N games per team with W/L results |
| Matchup History | Head-to-head record and recent meetings |
| Form Comparison | Win-loss trend chart for both teams |
| Rankings Comparison | Side-by-side league rank badges per stat |
| Standings | League standings with both teams highlighted |
Content Blocks
| Block | Description |
|---|---|
| Game Preview | Custom written content for upcoming games |
| Game Review | Custom written content for finished games |
| Raw Code | Unescaped HTML/JS/CSS (admin use) |
Data Required refers to season capability badges. Blocks that need unavailable data show a “No data” message or can be hidden.
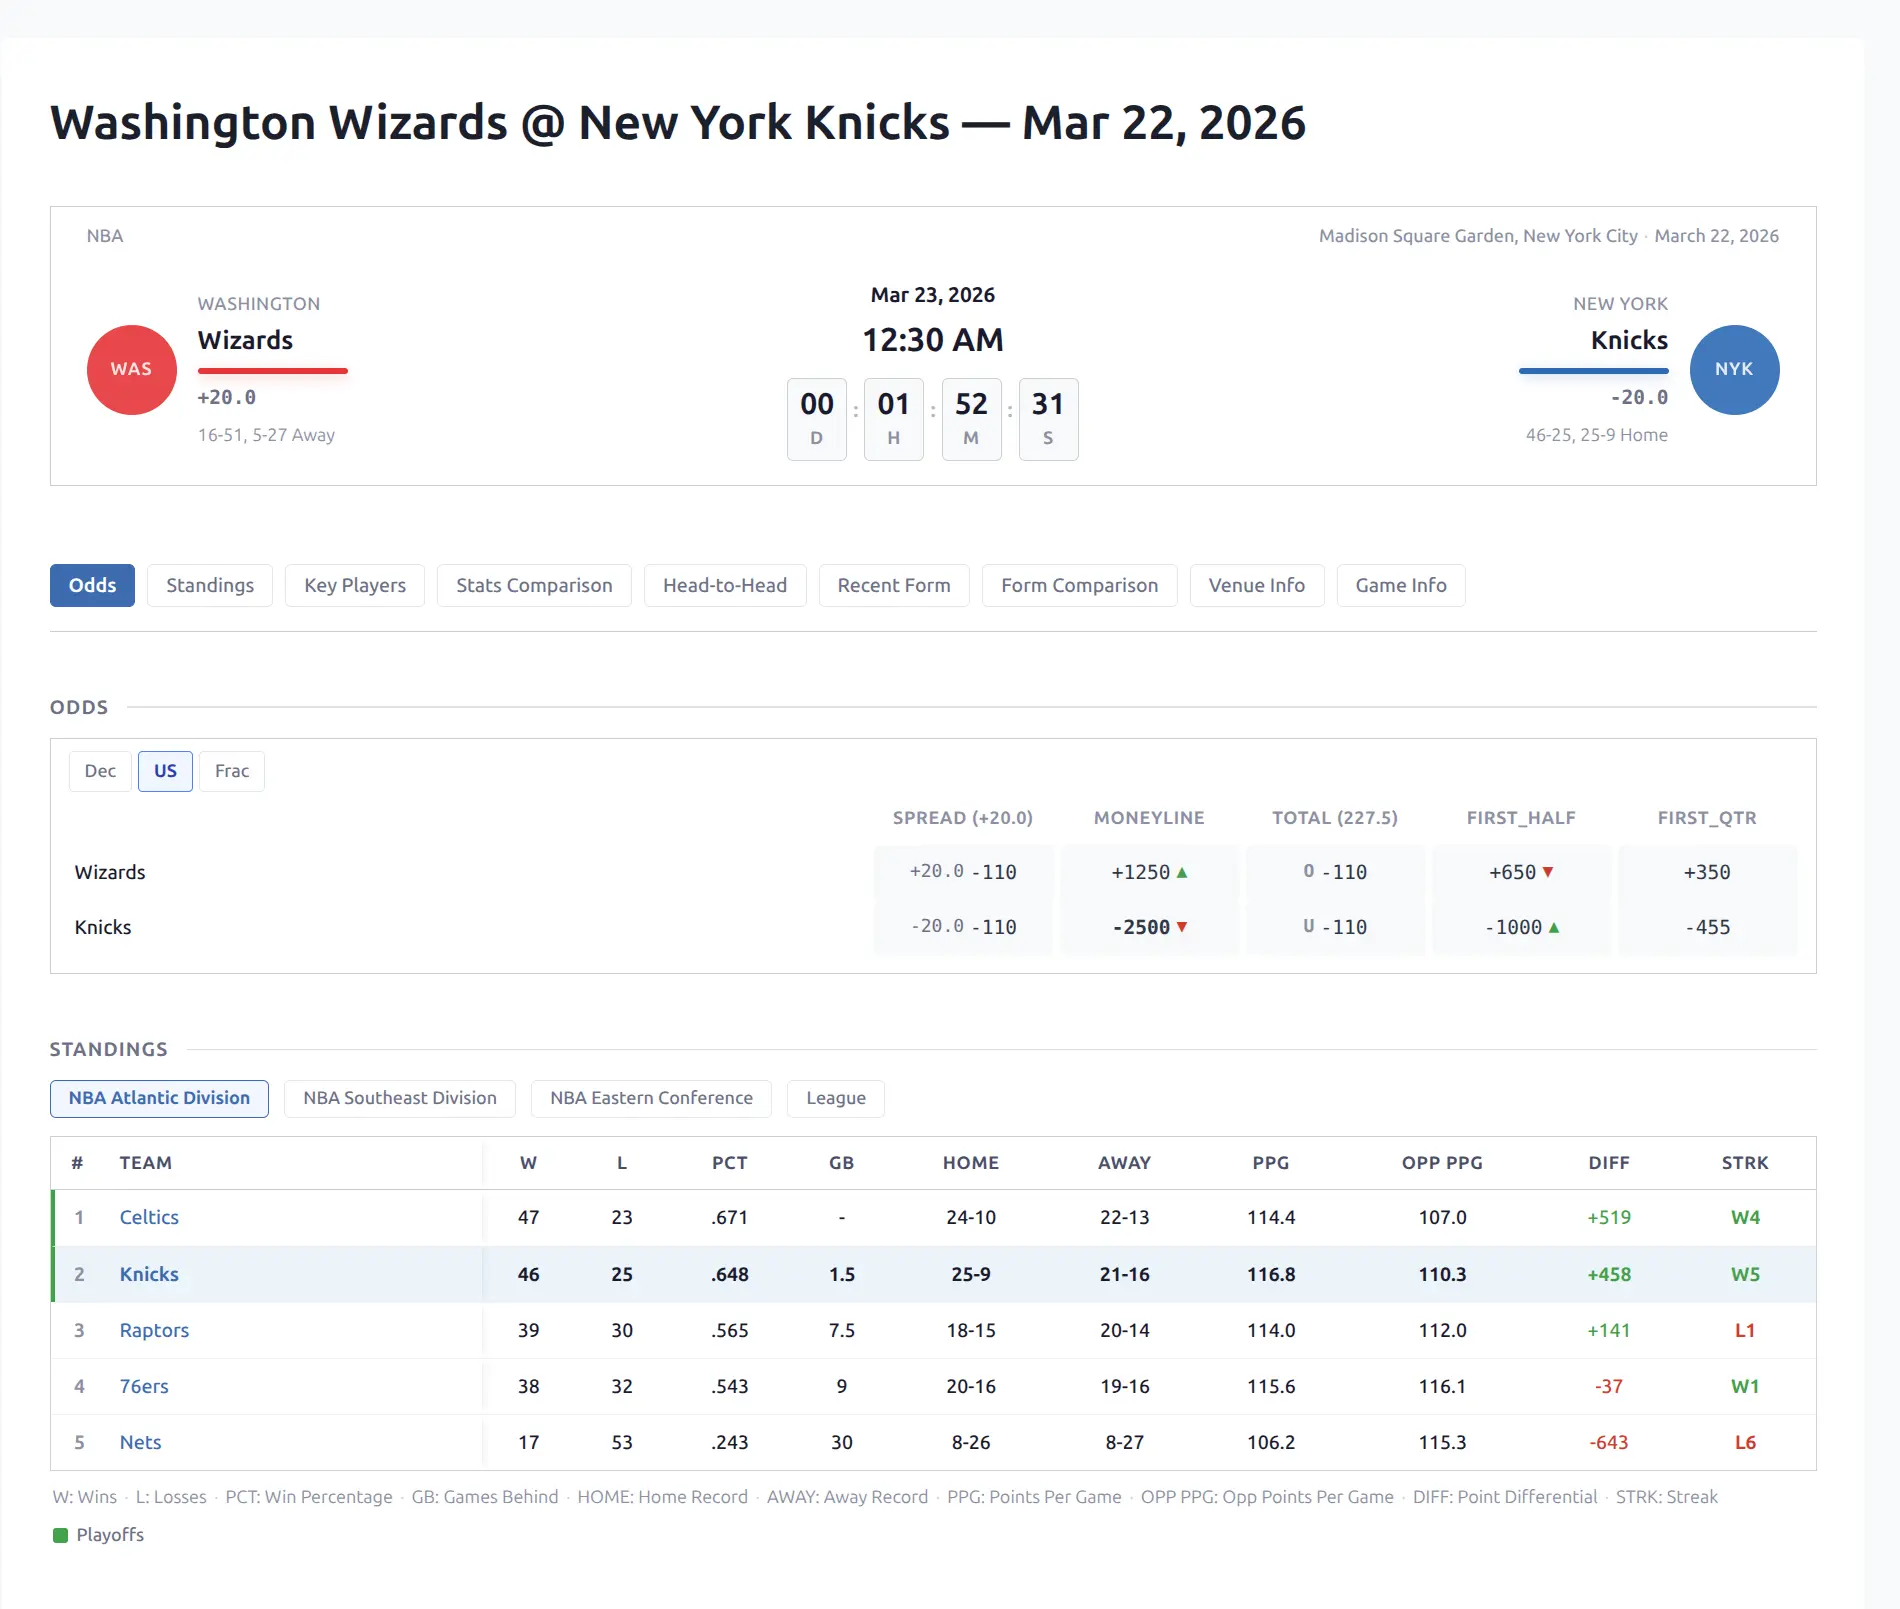
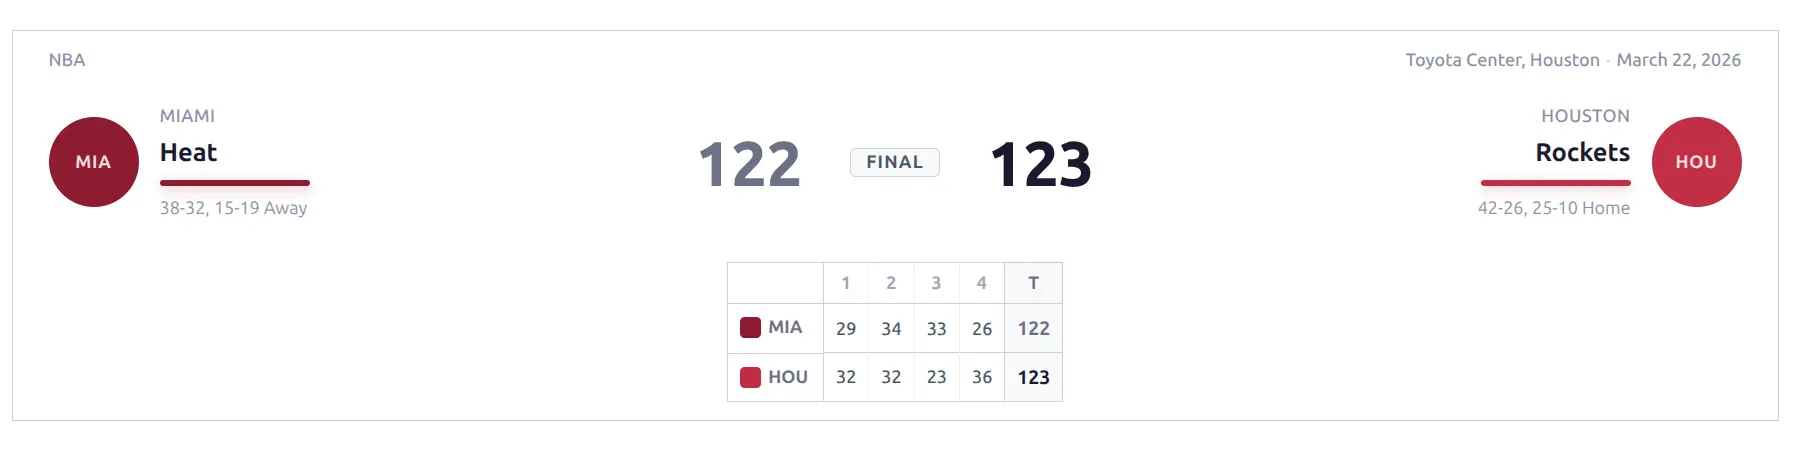
🏀 Game Header
The main scoreboard at the top of every game page. A 3-column layout: Team | Scores | Team.
What it shows:
- Team logos, city names, and team names
- Team-colored accent bars
- Scores (bold winner, dimmed loser)
- Period scores in a table below
- W-L records with home/away splits
- League name, venue, and date in the top bar
Three states:
- Finished — “FINAL” badge, all period scores visible, winner score bold
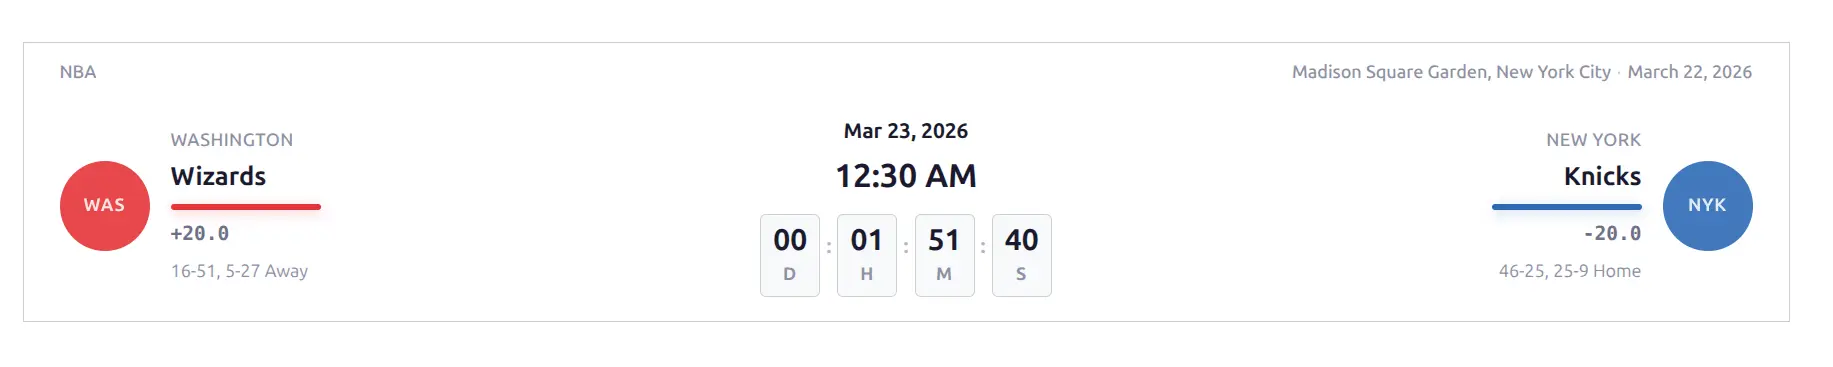
- Live — Red “LIVE” badge with pulsing dot, current period highlighted, live accent color
- Upcoming — Date and countdown timer in center, odds spread lines below team names, time auto-converted to visitor timezone
On smaller screens, full names switch to 3-letter team codes and the layout adapts automatically.
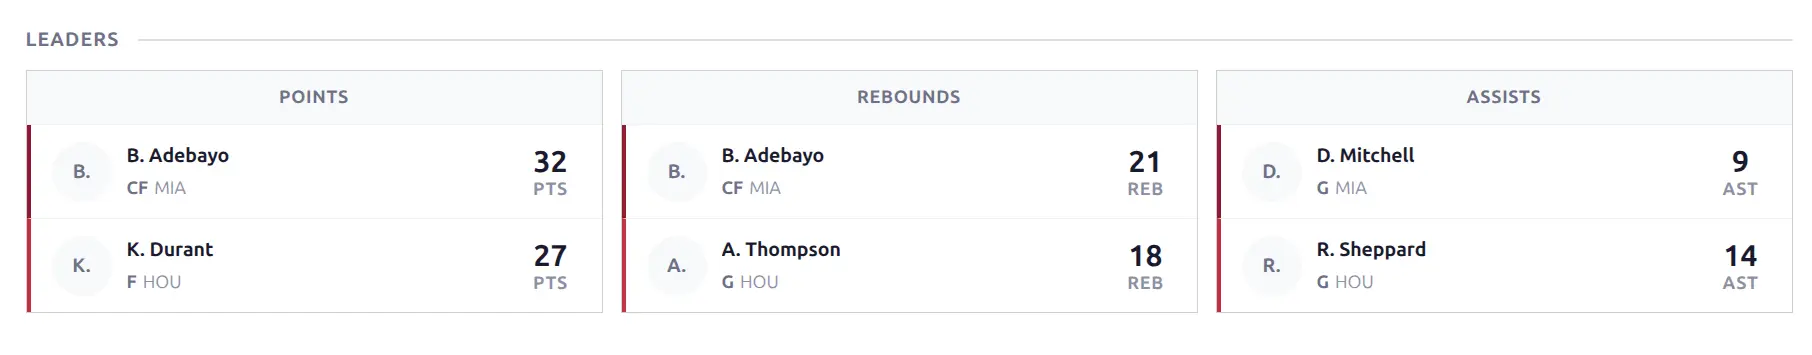
Game Leaders
A 3-category grid showing the top performer from each team in the game’s key stats.
- Basketball: Points, Rebounds, Assists
- Baseball: Hits, Home Runs, RBI
Each category shows the leading player from each team with their initials photo, name, position, team code, and stat value. The player with the higher value in each category is emphasized.
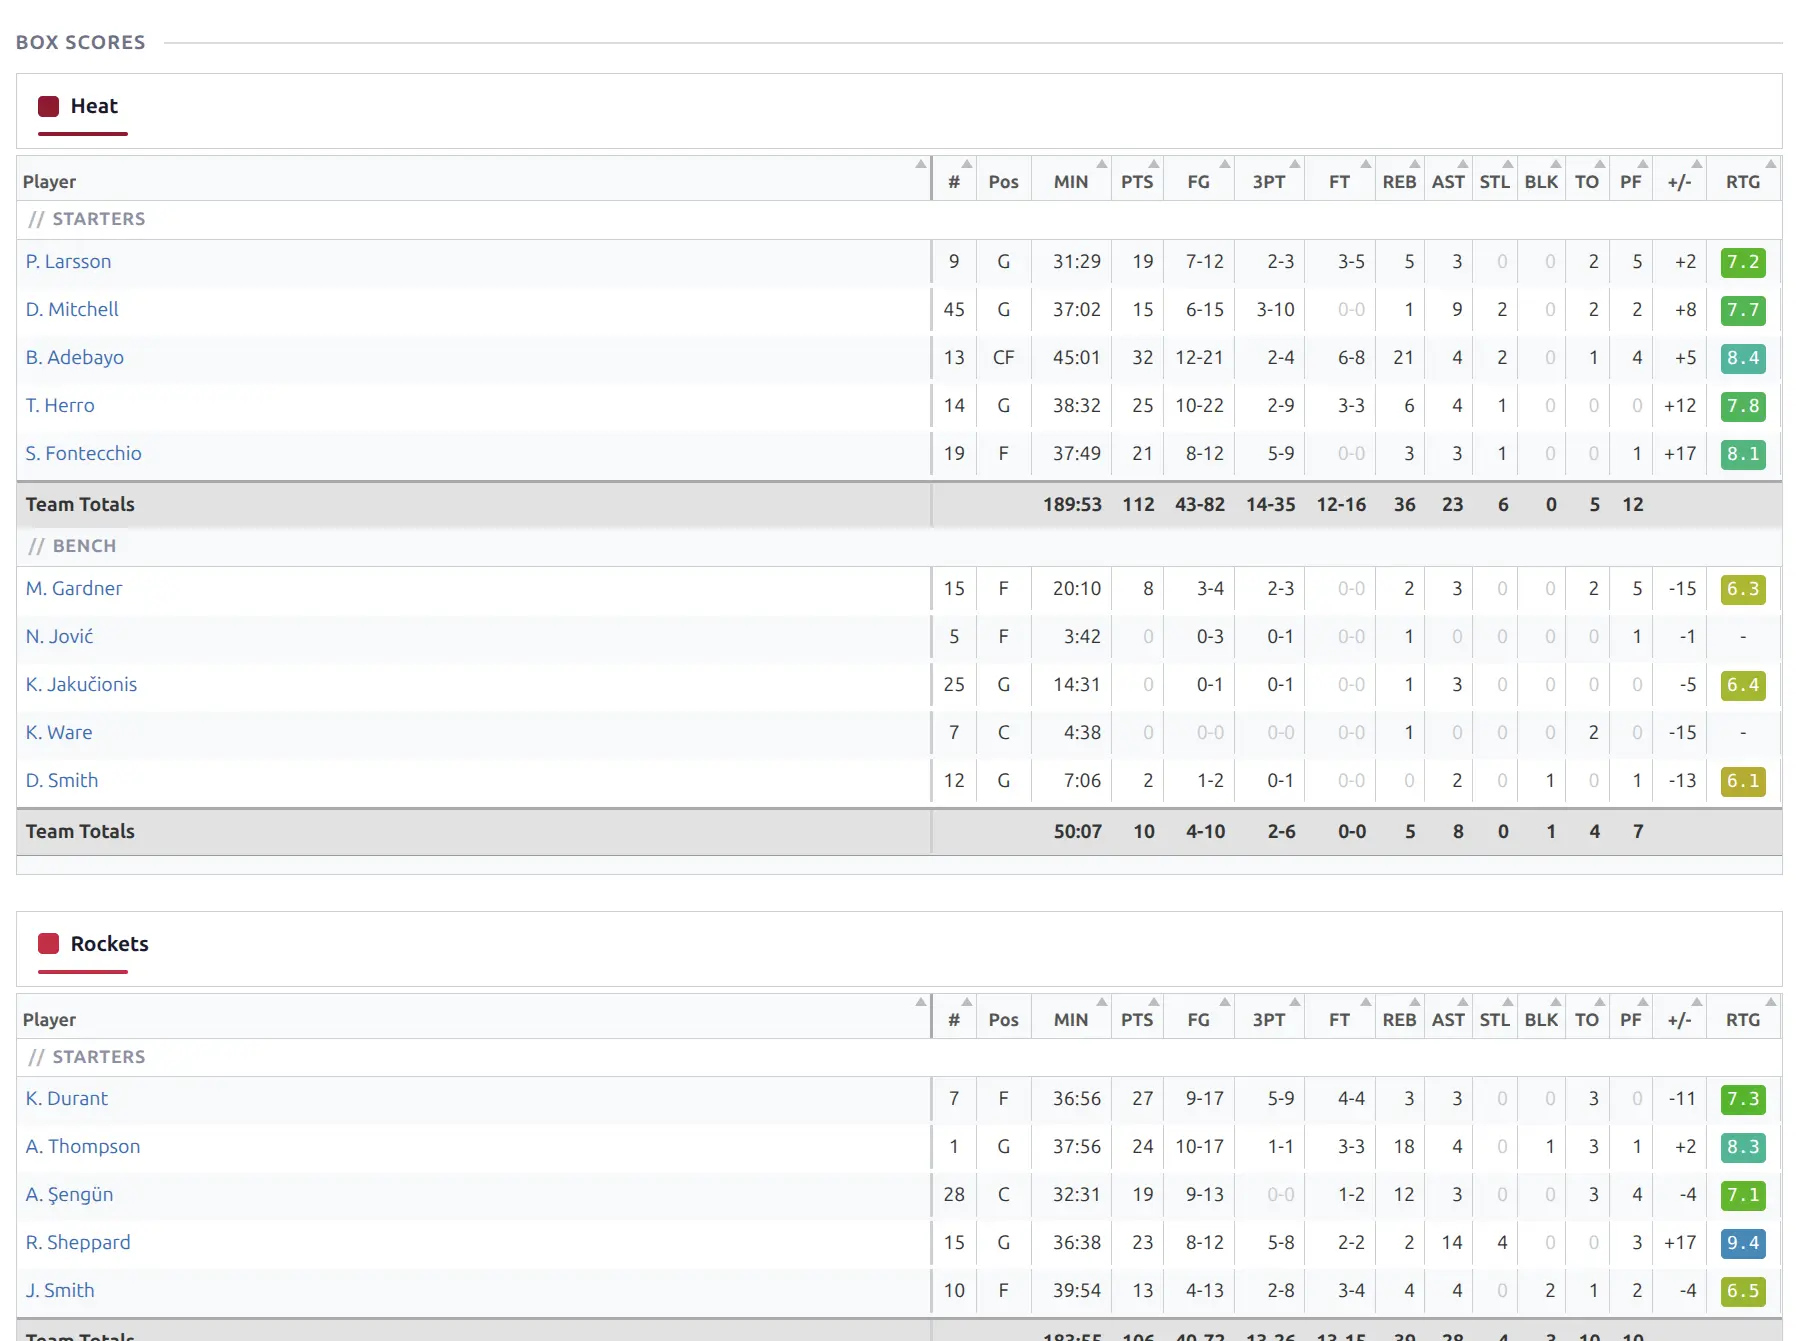
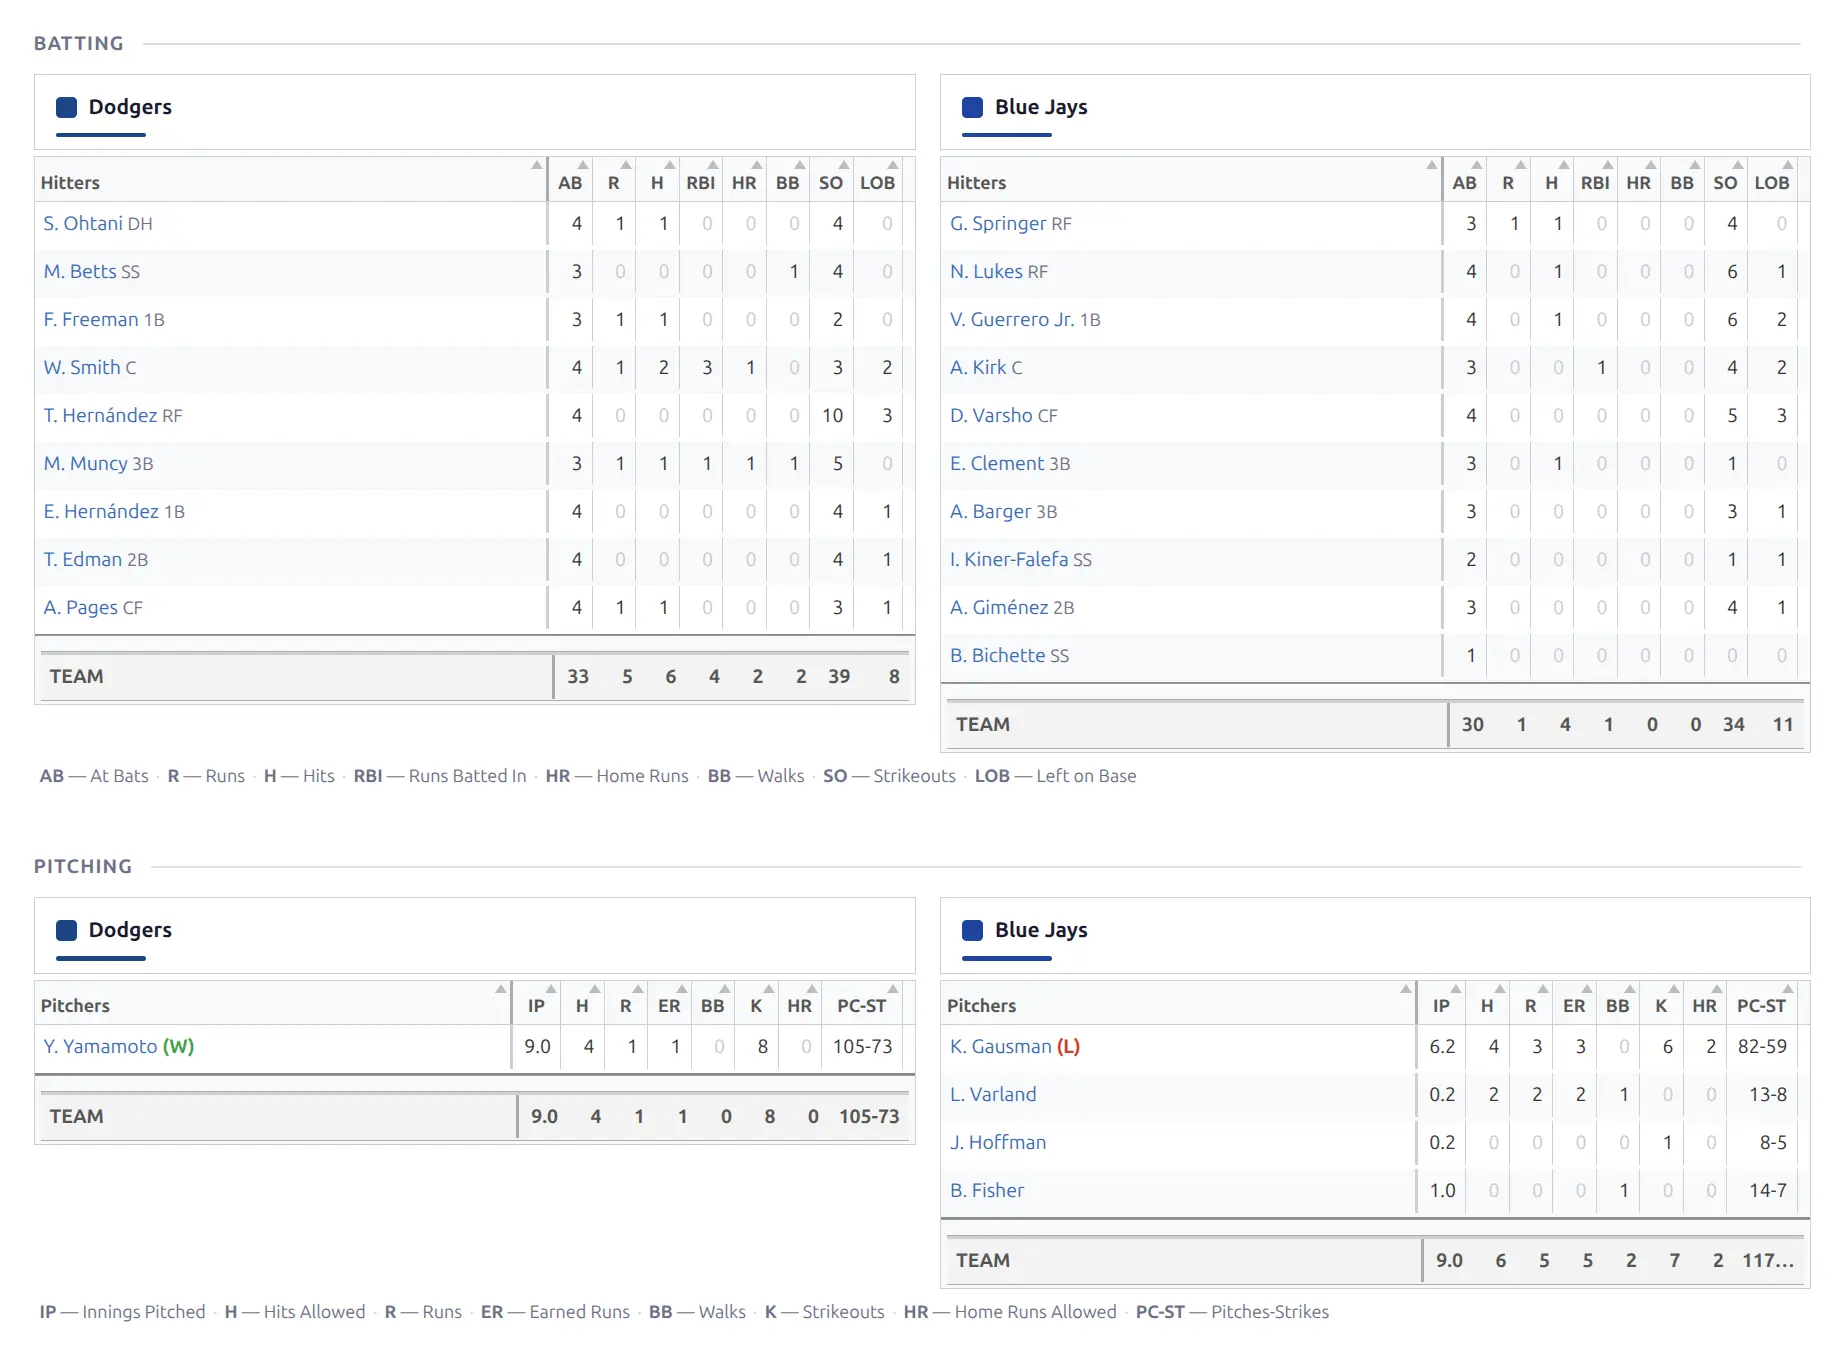
Box Scores
Per-player statistics tables powered by Tabulator.js — sortable columns, frozen player name column, and horizontal scrolling on small screens.
Basketball
Two tables (one per team) with columns: Player, #, Pos, MIN, PTS, FG, 3PT, FT, REB, AST, STL, BLK, TO, PF, +/-, RTG. Starters and bench players are separated. Team totals row at the bottom. Player rating shown as a color-coded badge (green for high, red for low).
Baseball
Batting — Two tables with: Hitters, AB, R, H, 2B, 3B, HR, RBI, BB, SO, LOB, plus team totals. On wide screens, tables display side by side — the plugin measures table width and automatically switches between stacked and side-by-side layout.
Pitching — Two tables with: Pitchers, IP, H, R, ER, BB, K, HR, PC-ST (pitch count/strikes). Decision column shows W/L/S/H. A stat legend with abbreviation definitions appears below the tables.
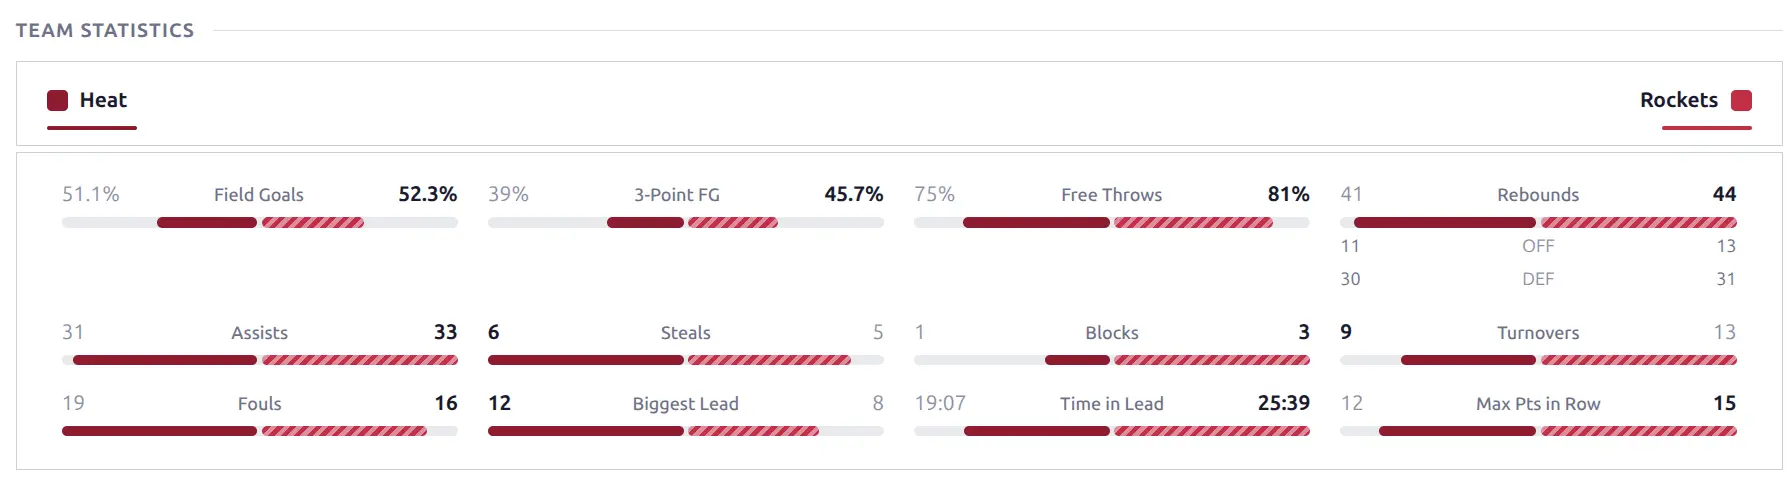
Team Statistics
Side-by-side comparison of team stats with colored proportion bars. Team headers with logos and accent bars anchor each side.
Each stat cell shows: Team 1 value — stat label — Team 2 value, with a colored bar below showing the proportion.
- Basketball: Shooting percentages (Field Goals, 3-Point FG, Free Throws) + counting stats (Rebounds with OFF/DEF breakdown, Assists, Steals, Blocks, Turnovers, Fouls, Biggest Lead, Time in Lead, Max Pts in Row)
- Baseball: Three titled groups — Batting, Pitching, Fielding
The higher value is bold. For inverse stats (turnovers, fouls), the lower value wins. When two teams have similar colors, one team’s bar gets a diagonal stripe pattern so they remain visually distinct.
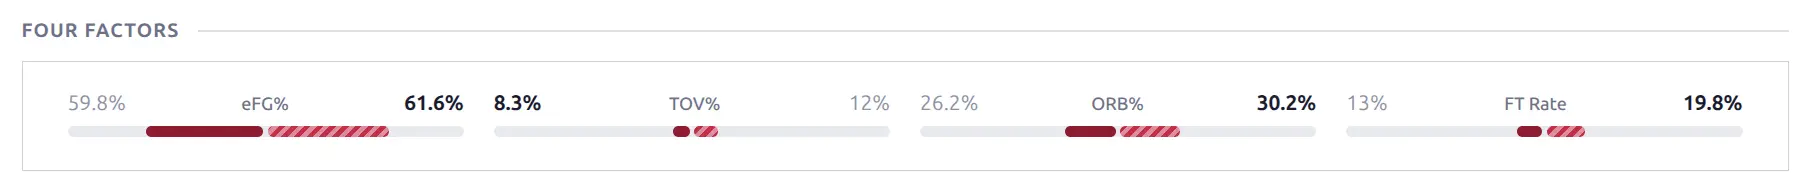
Four Factors
Dean Oliver’s basketball efficiency metrics — four key stats that predict winning: eFG% (effective field goal %), TOV% (turnover rate), ORB% (offensive rebound %), and FT Rate (free throw rate). Displayed as comparison bars using the same layout as Team Statistics. Available for basketball only.
Play-by-Play
A chronological event log showing each scoring play and key moment.
Basketball
3-column layout: Team 1 events | Running score | Team 2 events. Each play shows player name, play type badge (3PT, 2PT, FT), and running score in the center. Events are grouped by period (Q1–Q4, OT). Scrollable with a max-height to prevent long timelines from dominating the page.
Baseball
Events grouped by half-innings (TOP 1ST, BOT 1ST, etc.). Each play shows player name with event badges (HR, RBI), play description text, and running score. More descriptive than basketball — includes narrative play-by-play text.
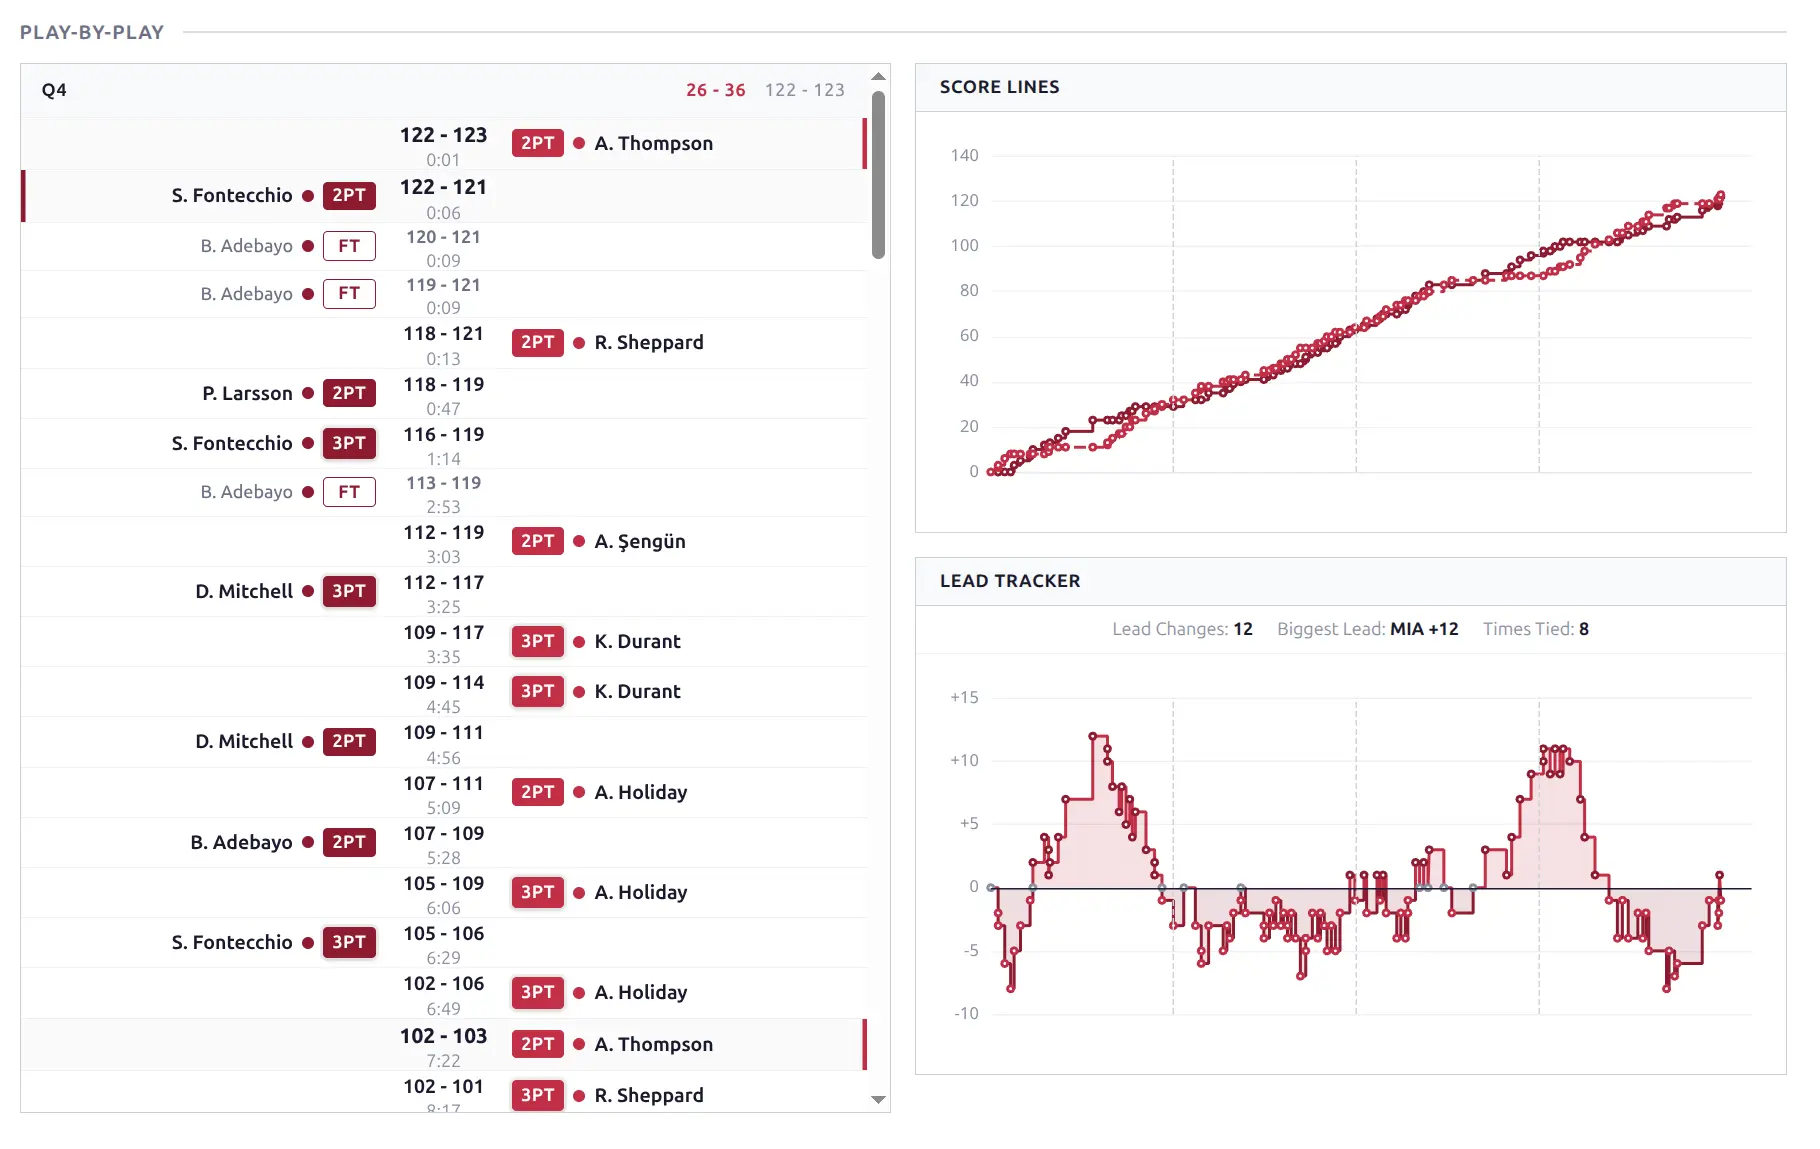
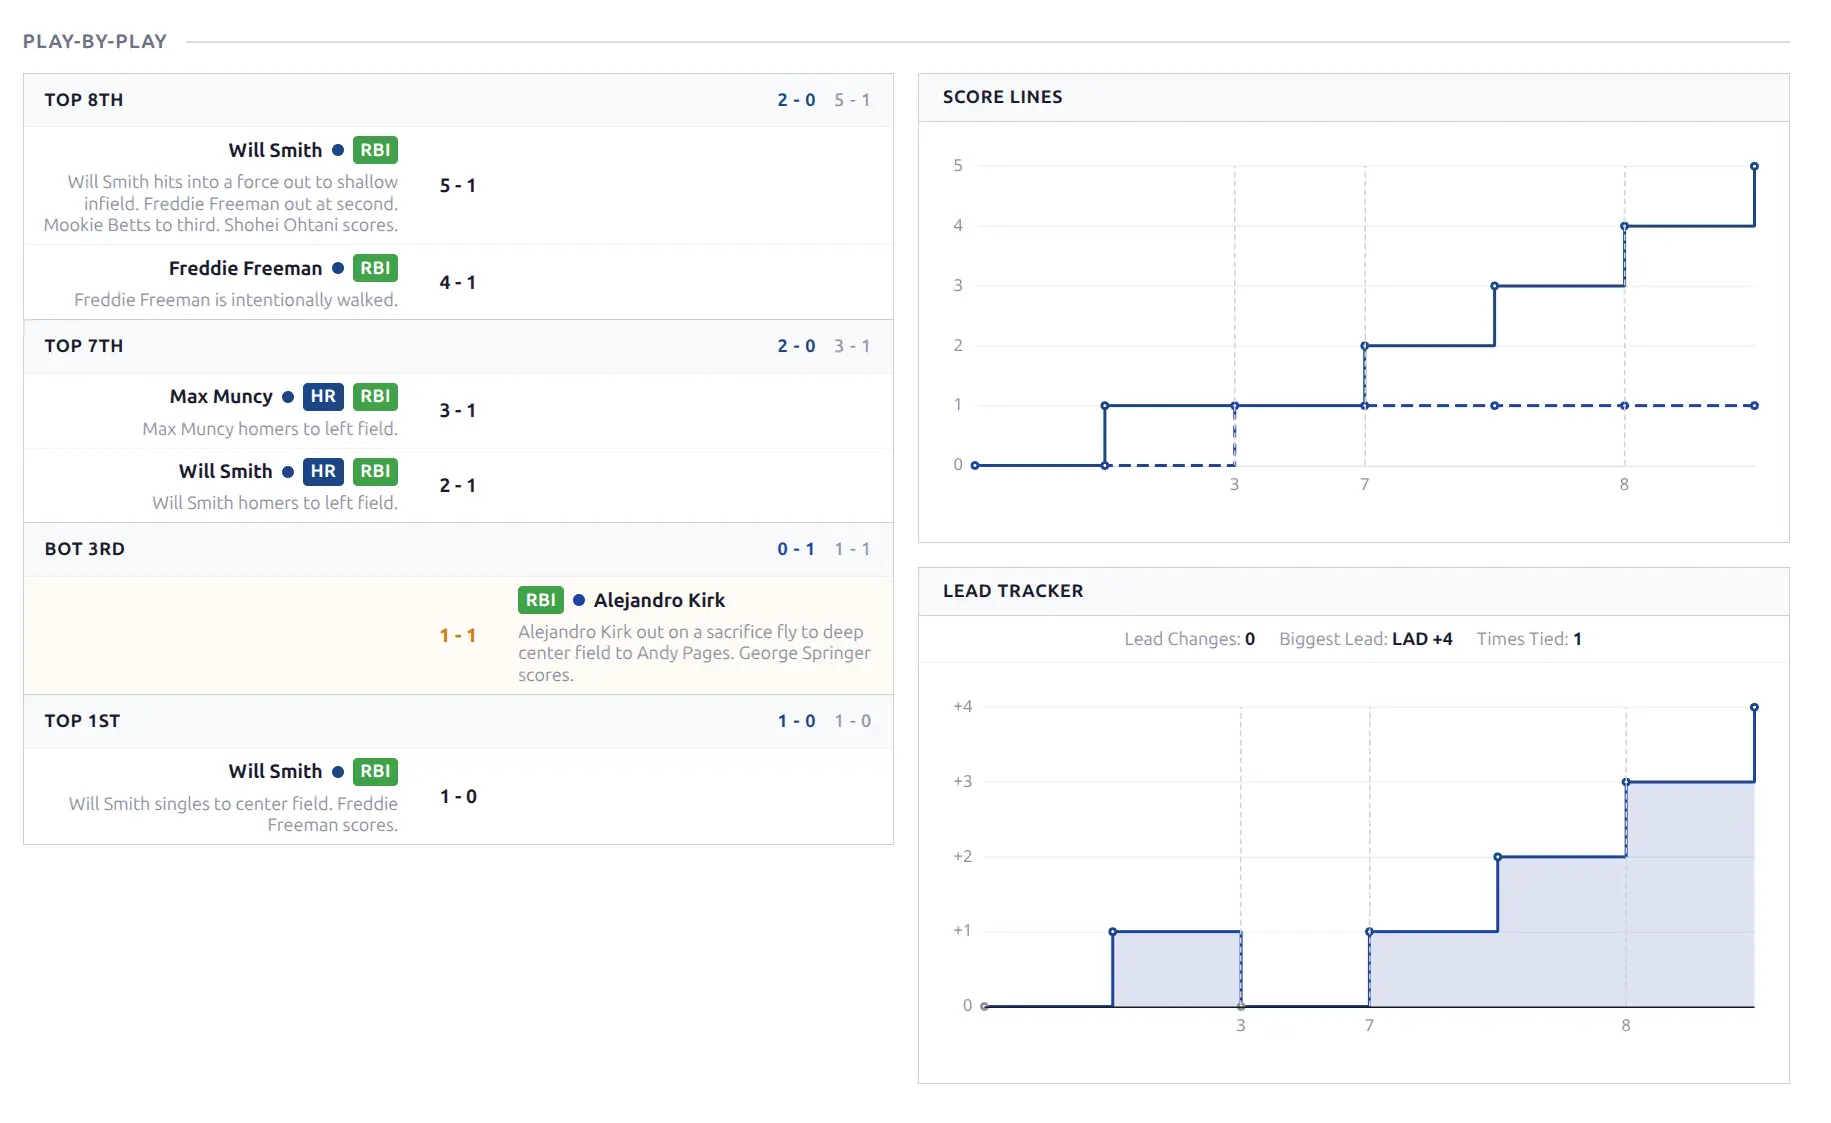
Game Flow Chart
Two ECharts panels in a fluid grid:
- Score Lines — Cumulative score over time for both teams (line chart with team colors)
- Lead Tracker — Point/run differential over time (area chart, colored fill showing which team leads)
Basketball uses a time-based x-axis; baseball uses sequential at-bat numbering. Tooltip shows the exact score at each point. Lead Changes count, Biggest Lead, and Times Tied stats appear above the Lead Tracker. Both charts update automatically during live games.
Play-by-Play + Game Flow
A composite block that combines the play-by-play and game flow charts in a fluid grid layout — timeline on the left, charts stacked on the right. On narrow screens, the charts stack above the timeline in a single column.
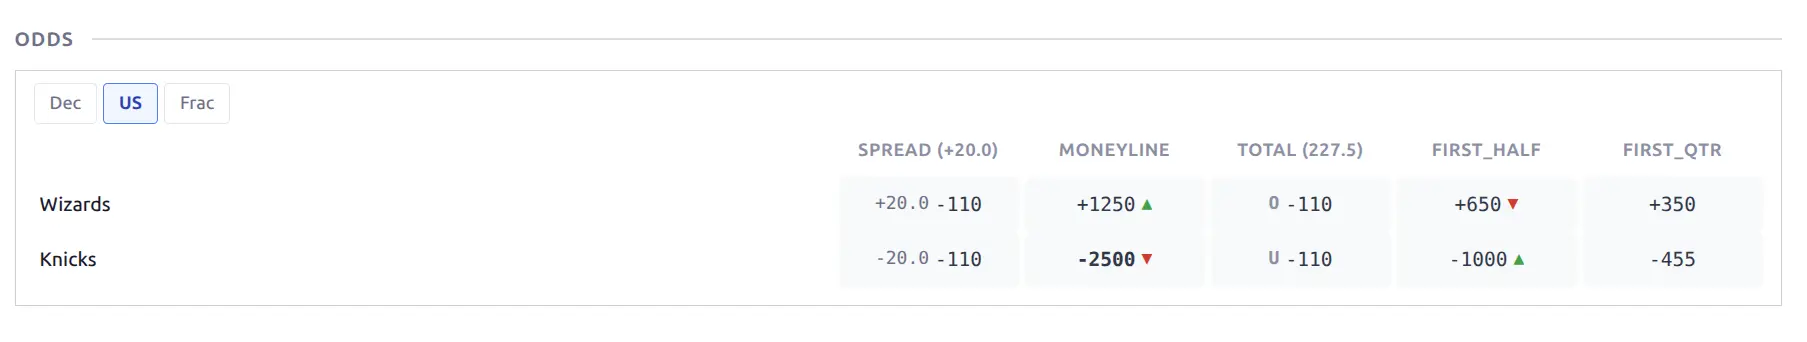
Odds
Betting odds table with up to 5 markets. A format switcher at the top lets visitors choose between Decimal, American (US), and Fractional display.
- Basketball: Spread, Moneyline, Total (Over/Under), First Half, First Quarter
- Baseball: Moneyline
Movement arrows (green up / red down) indicate line changes. On narrow screens, less common markets are hidden with horizontal scroll to reveal them. Odds also appear inline on game cards and in the game header for upcoming games (spread line below each team name).
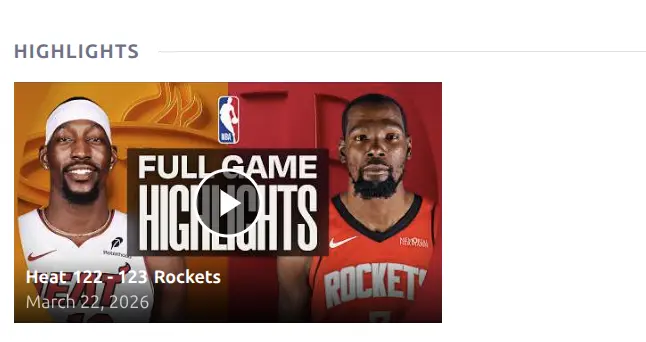
Highlights
YouTube video highlights grid. Each card shows the video thumbnail with a play button overlay, game score, team logos, and date. Videos are fetched automatically during import (when the “Highlights” option is enabled in API Config) and kept up to date by background sync.
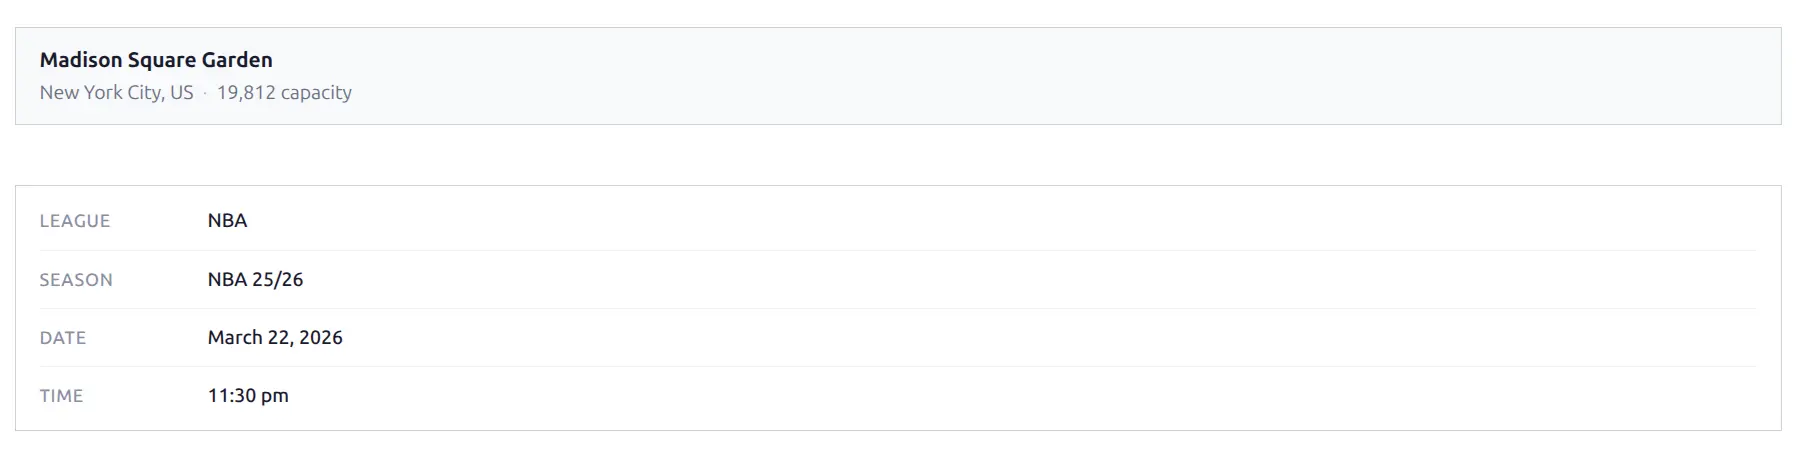
Venue & Game Info
Venue — Stadium/arena information card showing name, city, country, and capacity in a subtle background surface.
Game Info — A metadata grid showing league, season, date, and time. Time is auto-converted to the visitor’s local timezone.
🎯 Pre-Game Blocks
Pre-game blocks help visitors analyze an upcoming matchup. All stats in these blocks are filtered to before the game’s kickoff time — so if you view a finished game’s upcoming layout, you’ll see the stats as they were before the game started.
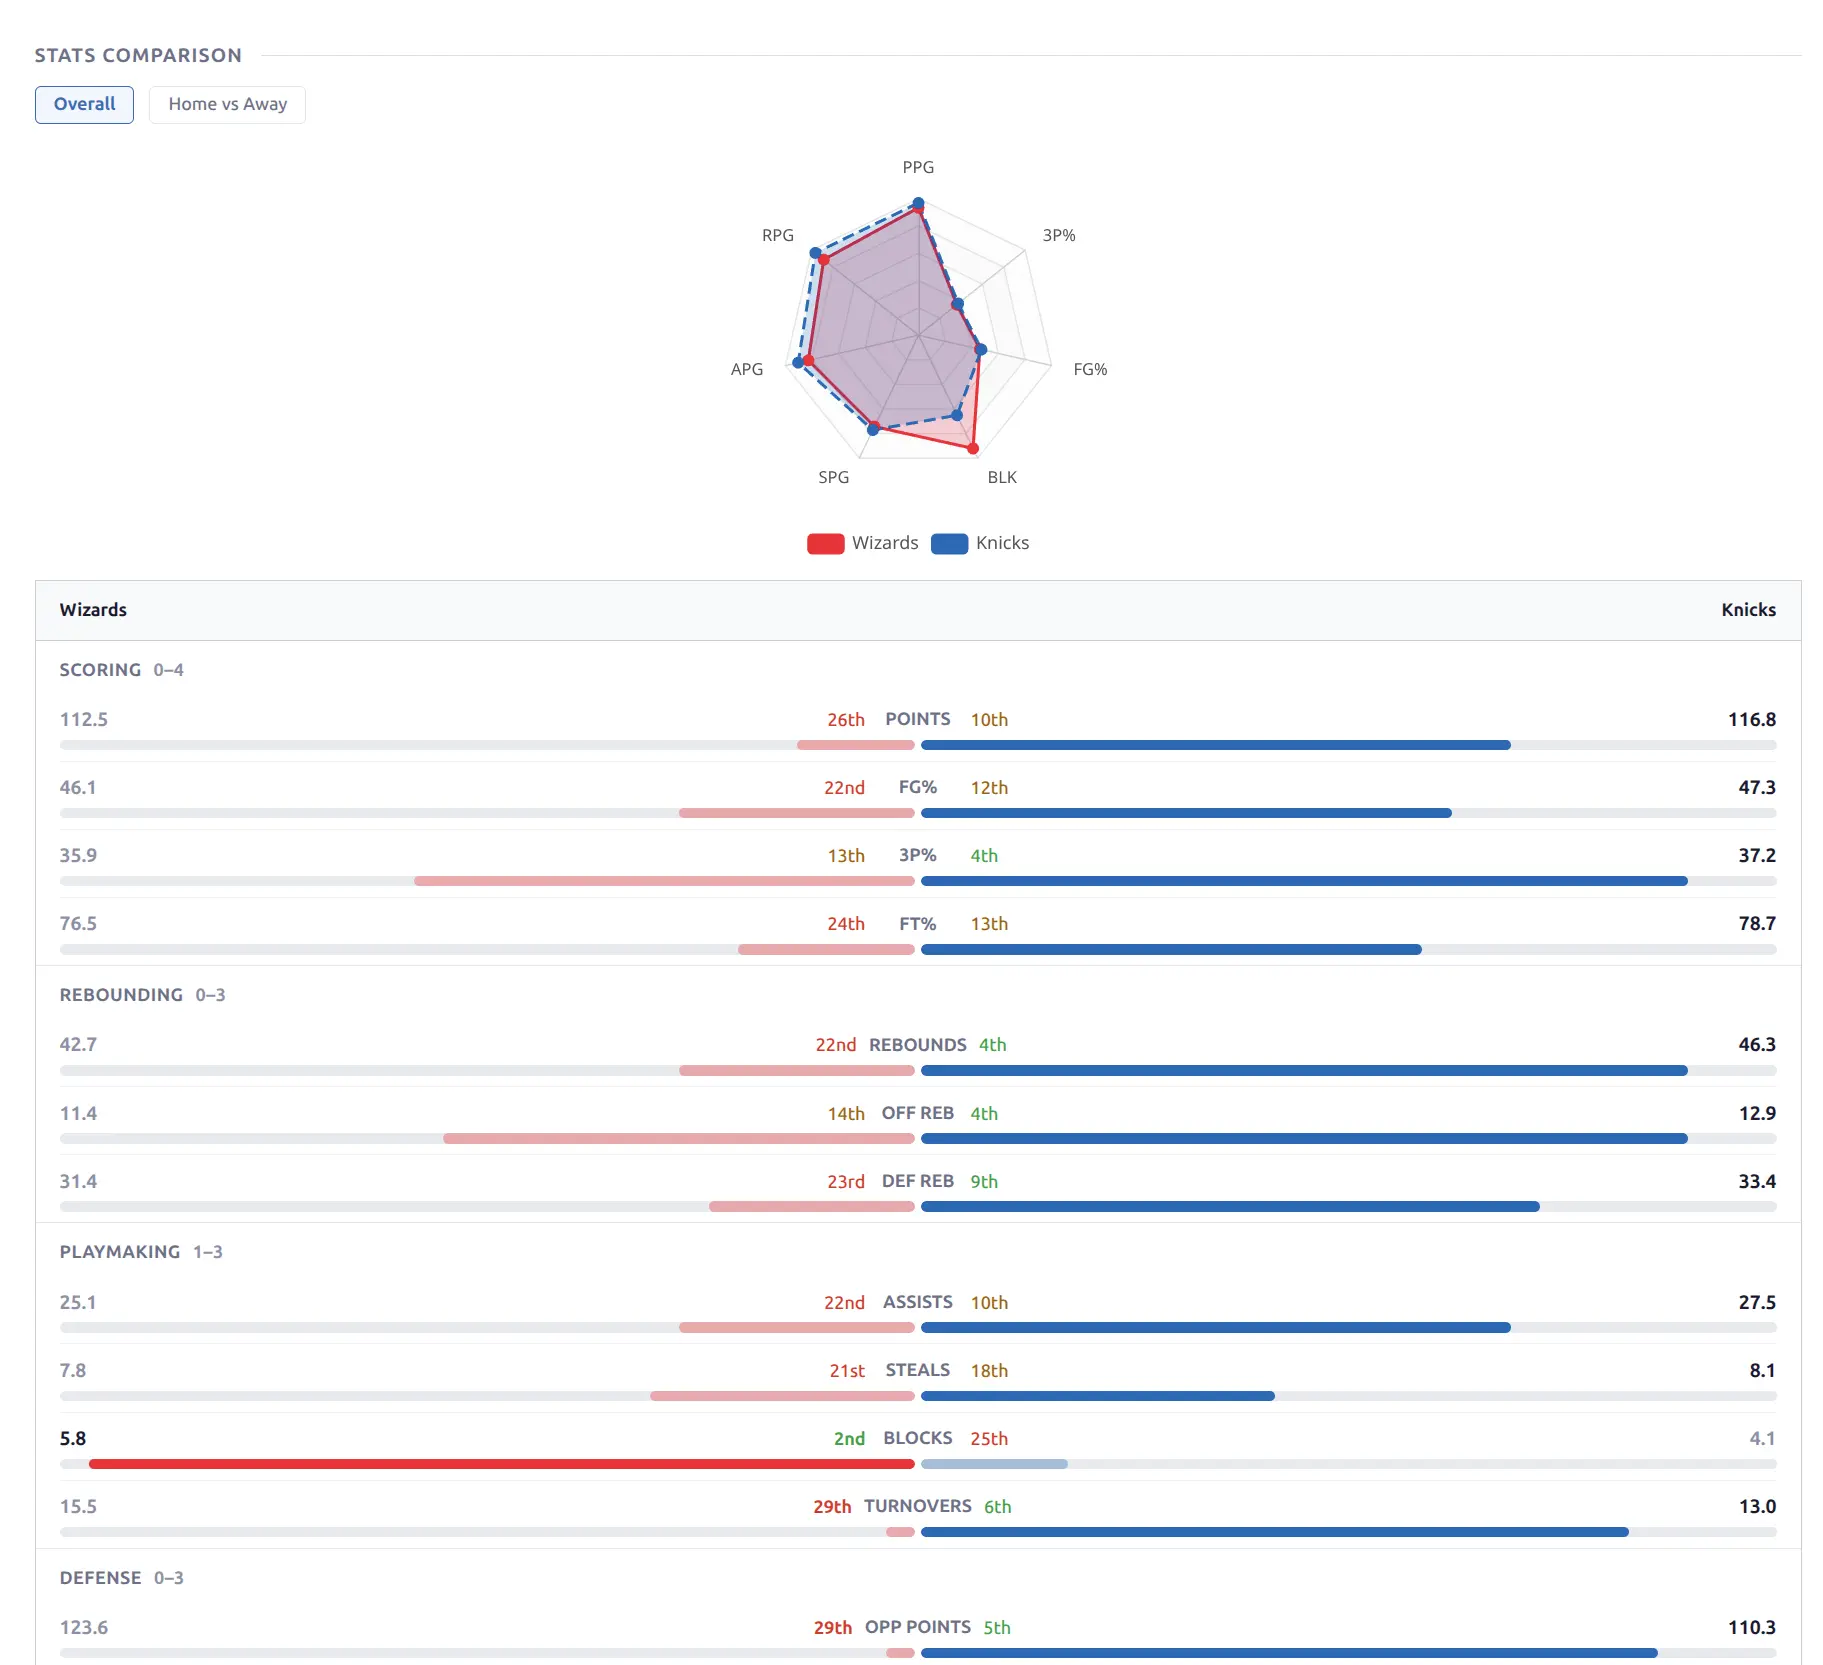
Stats Comparison
A detailed season-to-date comparison between both teams with two views: Overall and Home vs Away (switchable via pills).
- Radar chart at top — 6 key metrics (PPG, 3P%, FG%, BLK, SPG, RPG for basketball) in team colors
- Grouped stat bars below — organized by category (Scoring, Rebounding, Playmaking, Defense), each stat showing both teams’ values, proportion bars, and league rank badges (e.g., “4th”, “22nd”)
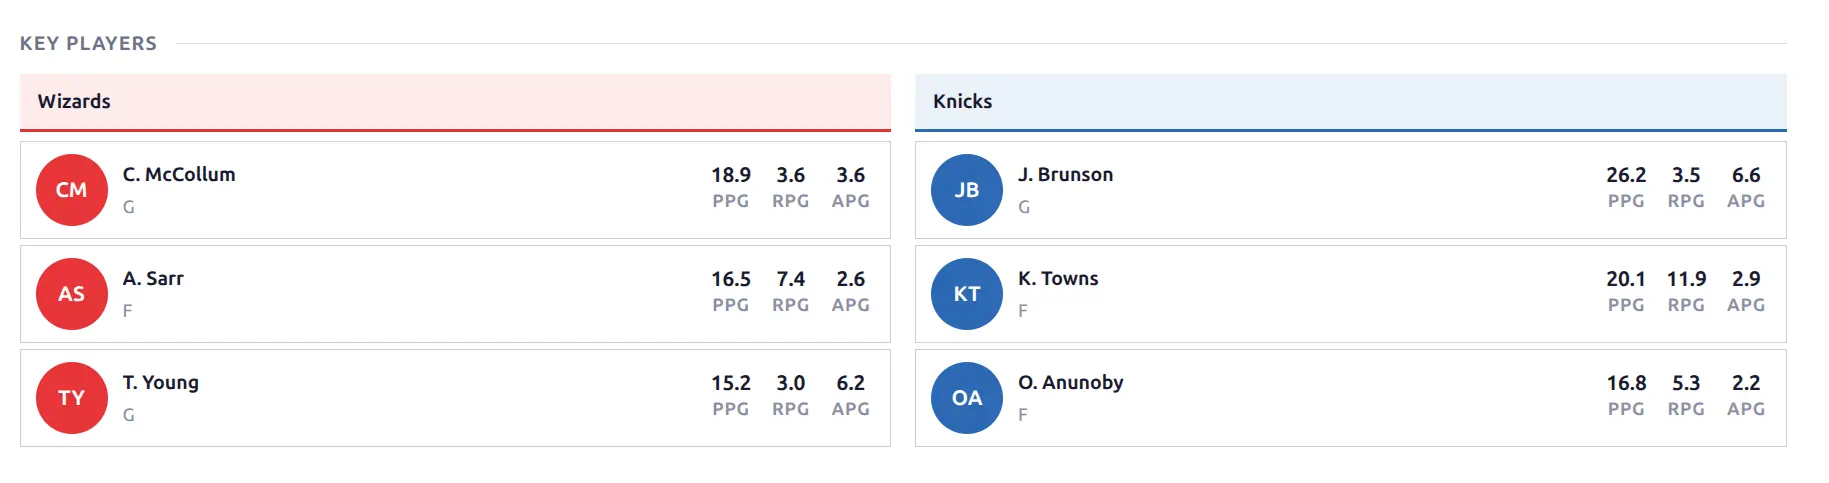
Key Players
Top N players per team based on season averages (configurable limit, default 3). Each player shows initials photo in team color, name, position, and 3 key stats.
- Basketball: PPG, RPG, APG
- Baseball: AVG, HR, RBI (batting) or ERA, SO, W-L (pitching)
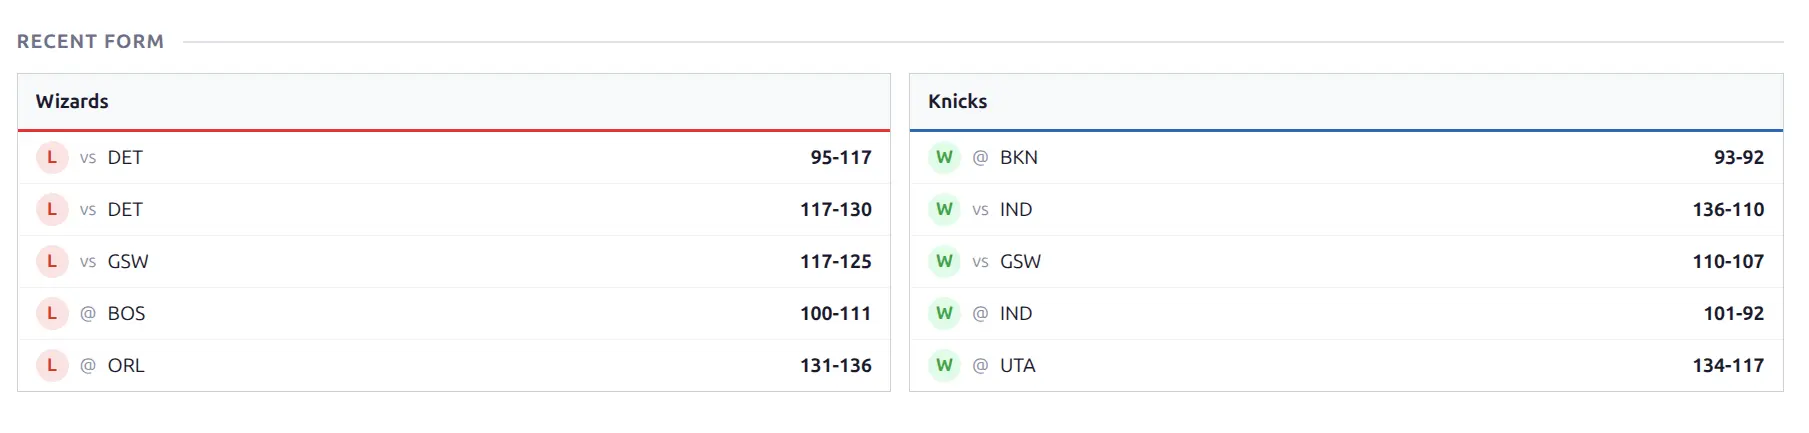
Recent Form
Side-by-side display of each team’s last N games (default 5). Each row shows: W/L badge (green/red), venue indicator (vs home / @ away), opponent code, and final score. A quick visual comparison of current momentum heading into the game.
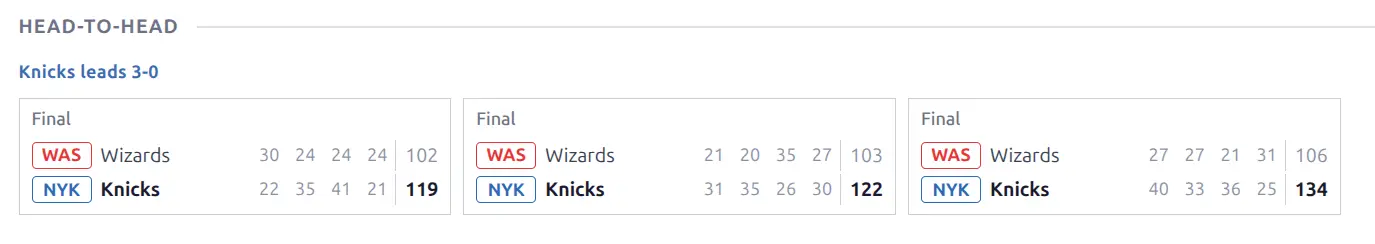
Matchup History (Head-to-Head)
Head-to-head record and recent meetings between both teams. The header shows the aggregate series record (e.g., “Knicks leads 3-0”). Each previous meeting is shown as a compact card with team badges, period scores, and final score. Hover over any card to see a game peek popup with more details. The number of games shown is configurable in the Layout Builder.
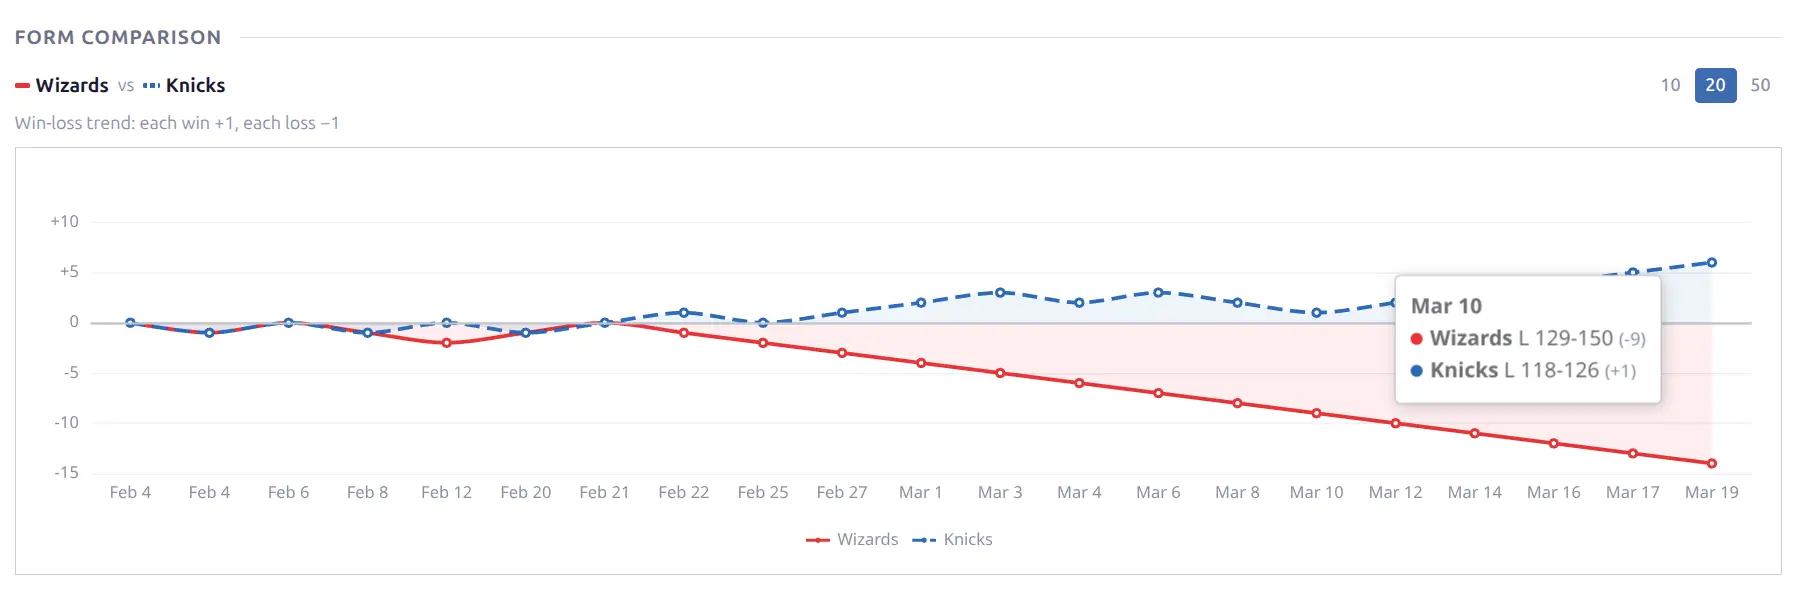
Form Comparison
A win-loss trend chart showing both teams’ recent form as overlaid lines. Each win = +1, each loss = -1, plotted cumulatively over time. The chart uses team colors (solid line for one team, dashed for the other) with colored area fill showing the trend direction.
Count presets (10 / 20 / 50 games) let visitors adjust the time window. Hover to see specific game details (date, opponent, score, differential).
Rankings Comparison
Side-by-side league rank badges for each stat category. Each stat shows both teams’ rank with tier-colored badges — elite (top tier) gets bold coloring, progressively muted for good, average, below average, and poor. Helps visitors quickly see each team’s strengths and weaknesses relative to the league.
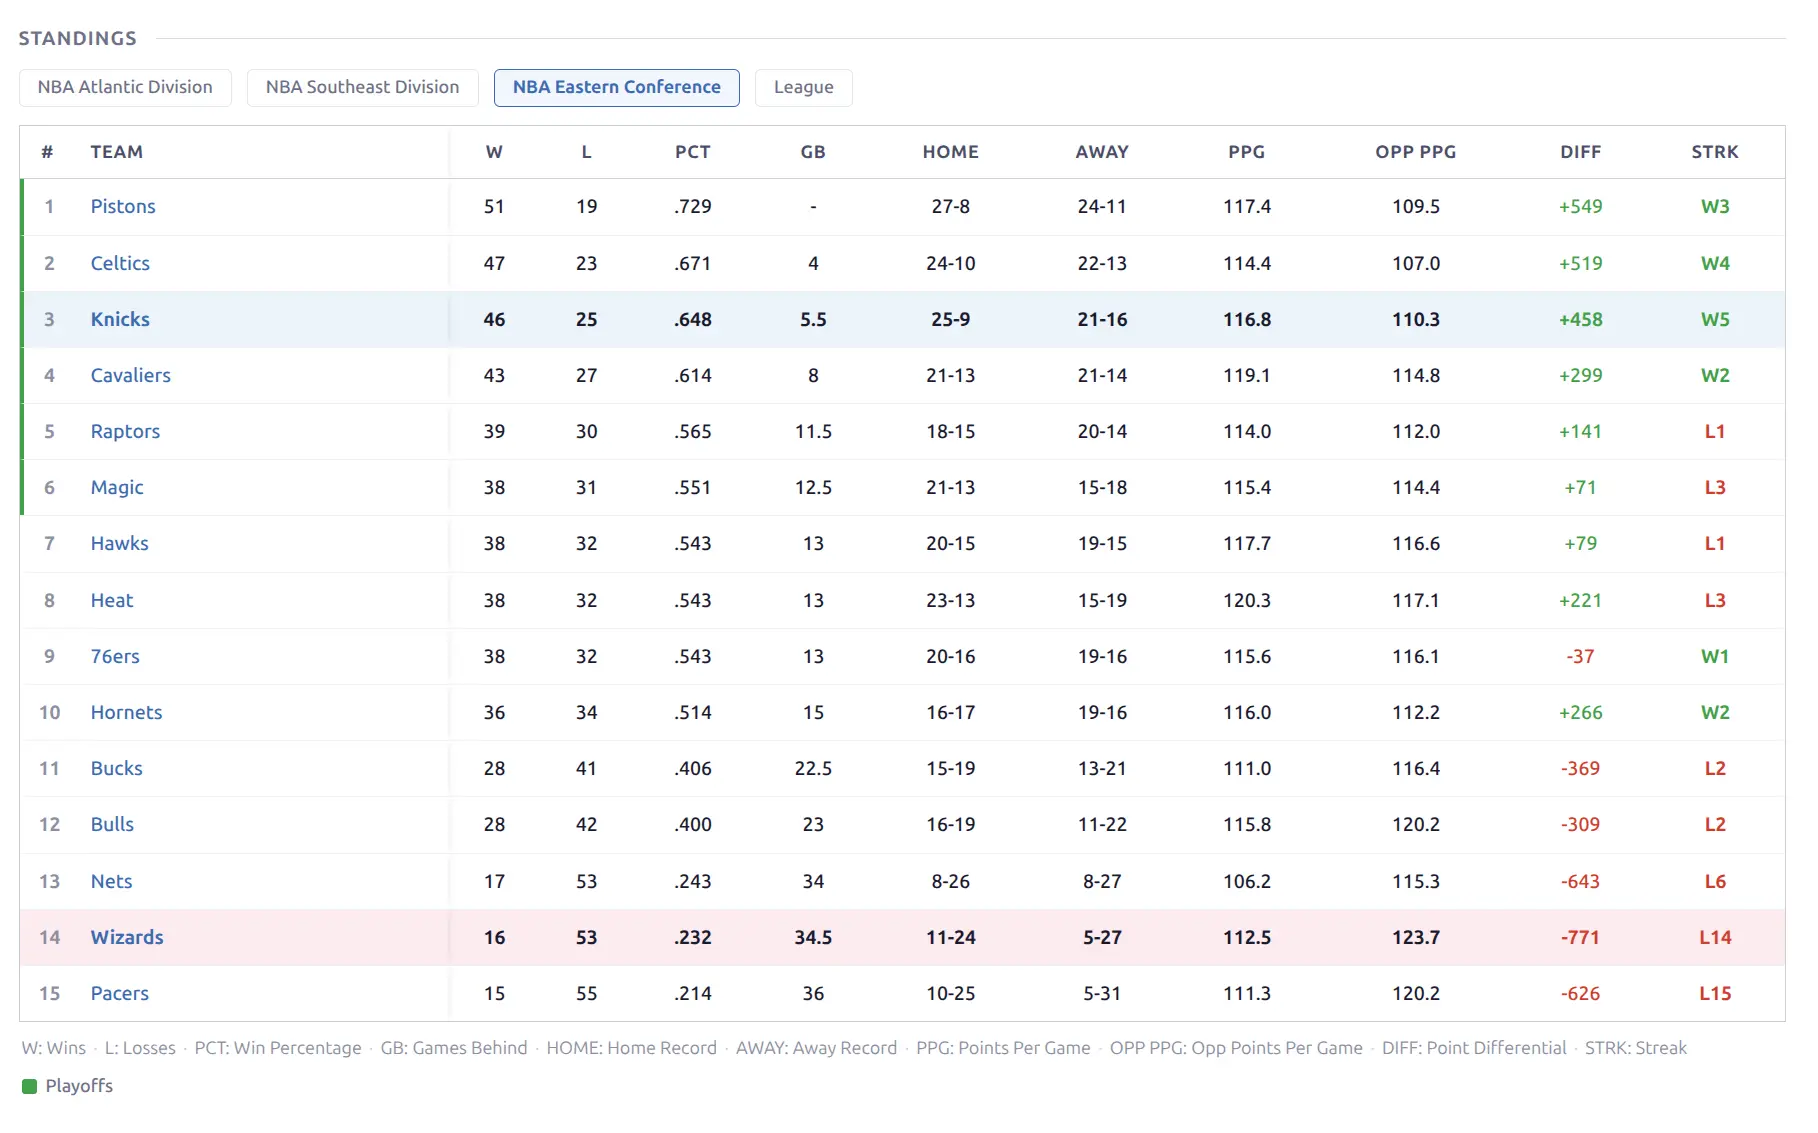
Standings Context
Full league standings table with both teams highlighted in their team colors. Visitors can switch between division, conference, and league views using pills above the table. Home/Away pills are also available for filtered records.
Content Blocks
Game Preview & Review
Custom written content blocks. You can write (or AI-generate) text content for any game:
- Game Preview — shown on upcoming game layouts, for pre-game analysis
- Game Review — shown on finished game layouts, for post-game recap
Content is entered via the WordPress post editor for each game (in the “Custom Content” metabox). Supports standard WordPress formatting. You can also use the AI Writer to automatically generate previews and reviews using game data.
Raw Code
An advanced block for embedding arbitrary HTML, JavaScript, or CSS. Useful for third-party widgets (odds providers, social feeds), custom embeds, or WordPress shortcodes (processed automatically). Only admin users can save raw code content.
Game Peek
Hovering over a game result link anywhere in the plugin (matchup history, recent form, player game log, team results) shows a floating preview card with the score, date, teams, and key stats — letting visitors preview game details without navigating away from the current page.
Live Updates
During live games, the page updates automatically without a full page reload:
- Score polling — checks for score changes every 30 seconds (configurable: 15/30/45/60s)
- Section polling — refreshes box scores, timeline, charts, and stats every 120 seconds (configurable: 60/120/180/300s)
- Score flash — brief yellow highlight animation when a score changes
- Layout transition — when a game starts or ends, the page automatically swaps to the appropriate layout (upcoming → live → finished) without reload
- Game end — status updates to “Final”, two final detail polls, then polling stops gracefully
See Live Scores for setup instructions.
📚 Related
- Layout Builder — Arrange and customize blocks on game pages
- Team Pages — Team-focused display with roster, stats, schedule
- Player Pages — Player stats, career data, game log
- Season Pages — Standings, bracket, scoreboard, leaders
- Live Scores — Real-time score updates setup
- AI Writer — Auto-generate game previews and reviews
- Shortcodes — Embed game lists, calendars, and brackets anywhere